Fig. B.1
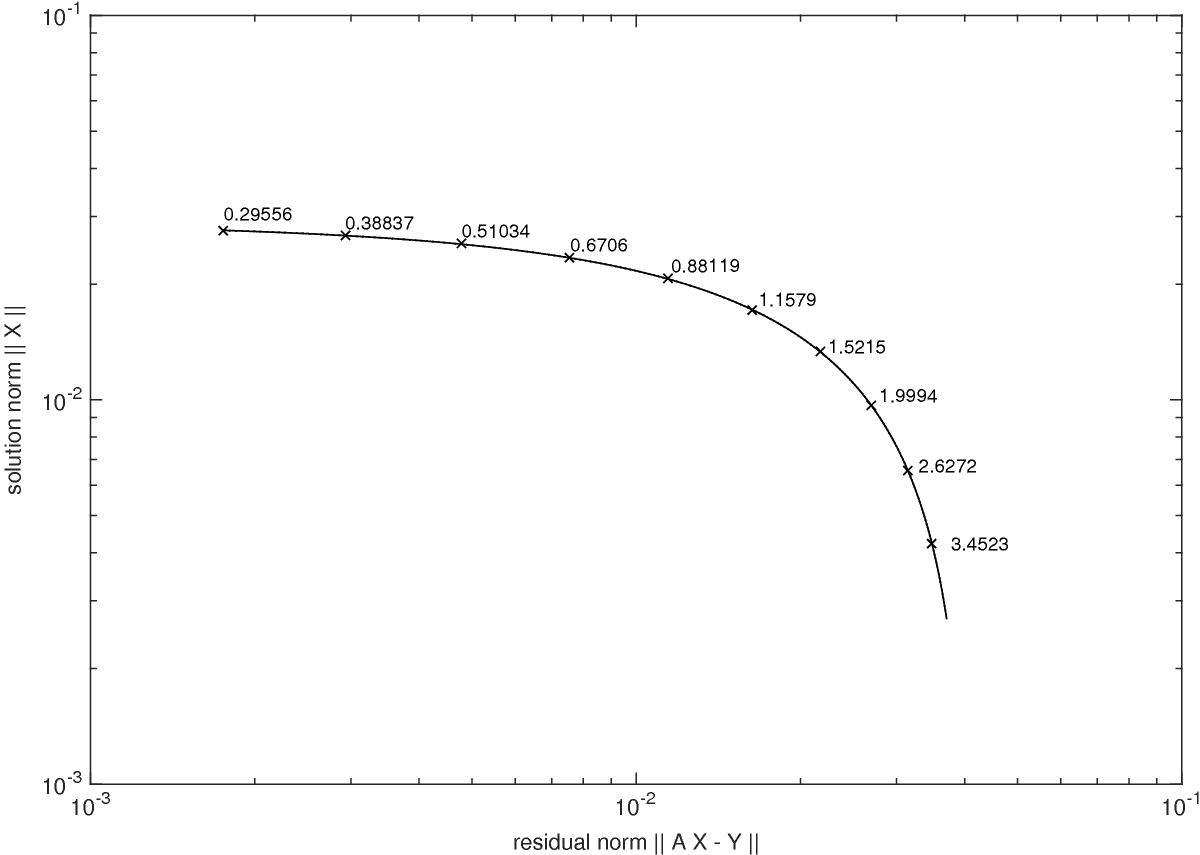
L-curve plot for the data obtained by the Monte Carlo sample for a unimodal distribution. Horizontal axis shows ![]() , i.e., the residuals of the regularization. Vertical axis shows
, i.e., the residuals of the regularization. Vertical axis shows ![]() , i.e., the norm of the regularization. Thihkonov parameter values (λ) are overplotted to the corresponding data points. Only the horizontal part of the typical “L” shape is shown. This situation occurs with very smooth exact solutions. See text for details.
, i.e., the norm of the regularization. Thihkonov parameter values (λ) are overplotted to the corresponding data points. Only the horizontal part of the typical “L” shape is shown. This situation occurs with very smooth exact solutions. See text for details.
Current usage metrics show cumulative count of Article Views (full-text article views including HTML views, PDF and ePub downloads, according to the available data) and Abstracts Views on Vision4Press platform.
Data correspond to usage on the plateform after 2015. The current usage metrics is available 48-96 hours after online publication and is updated daily on week days.
Initial download of the metrics may take a while.