Free Access
Fig. 4
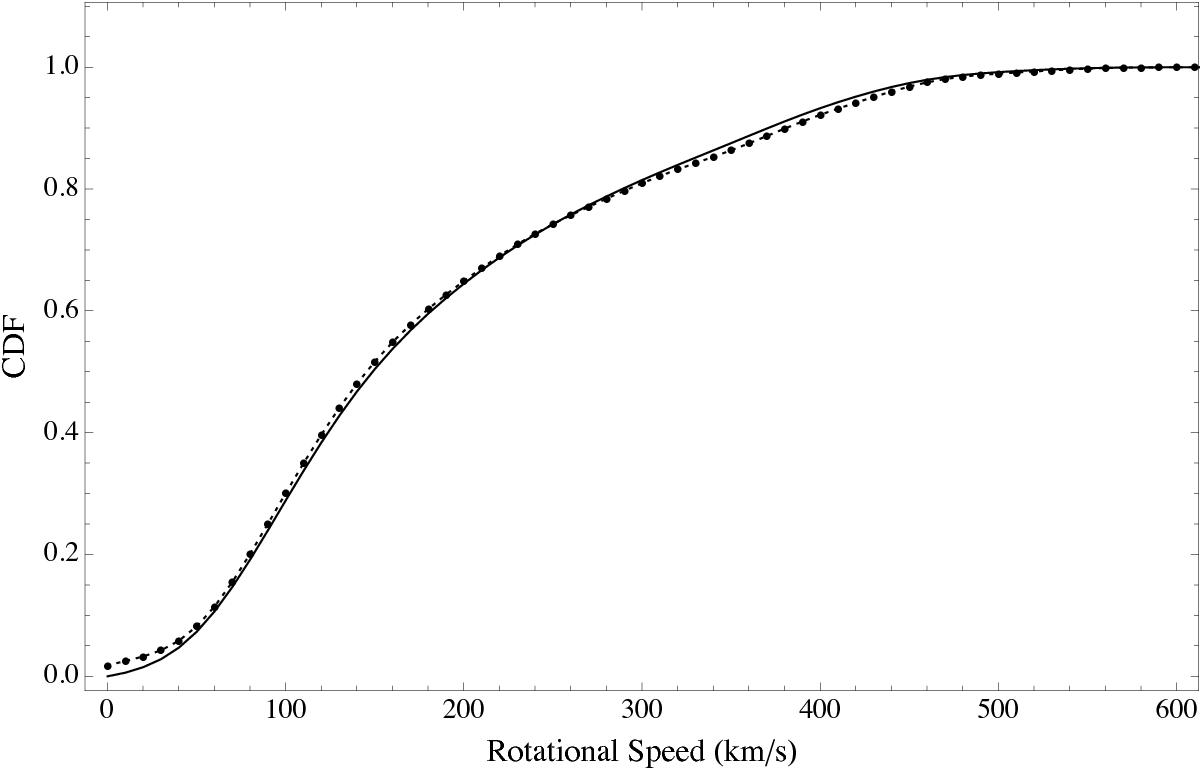
Estimated cumulative rotational velocity distribution function for the Tarantula sample (solid line) obtained using Tikhonov regularization using a spacing of Δx = 2 km s-1 for the velocities. Dots connected by dashed lines show the CDF calculated using the Curé et al. (2014) method with a spacing of Δx = 10 km s-1.
Current usage metrics show cumulative count of Article Views (full-text article views including HTML views, PDF and ePub downloads, according to the available data) and Abstracts Views on Vision4Press platform.
Data correspond to usage on the plateform after 2015. The current usage metrics is available 48-96 hours after online publication and is updated daily on week days.
Initial download of the metrics may take a while.