Fig. 3
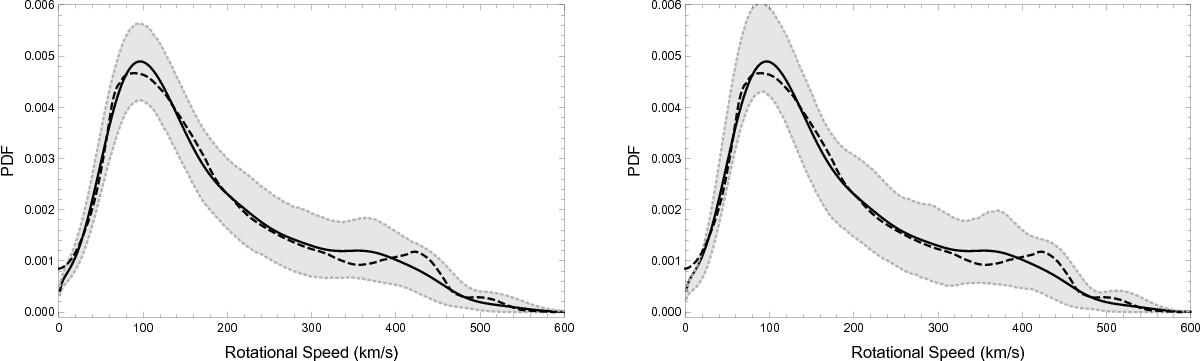
Estimated PDF from the Tarantula sample (solid lines). Both panels with λ = 0.0174 and Δx = 2 km s-1, Left panel with bandwidth h1 = 35.676 and right panel with bandwidth h2 = 30.313. Gray-shaded regions represent the 2.5% (lower) and 97.5% (upper) confidence intervals calculated using a bootstrap method. Dashed lines show the PDF (from Ramírez-Agudelo et al. 2013) obtained using the Lucy (1974) method.
Current usage metrics show cumulative count of Article Views (full-text article views including HTML views, PDF and ePub downloads, according to the available data) and Abstracts Views on Vision4Press platform.
Data correspond to usage on the plateform after 2015. The current usage metrics is available 48-96 hours after online publication and is updated daily on week days.
Initial download of the metrics may take a while.