Fig. 1
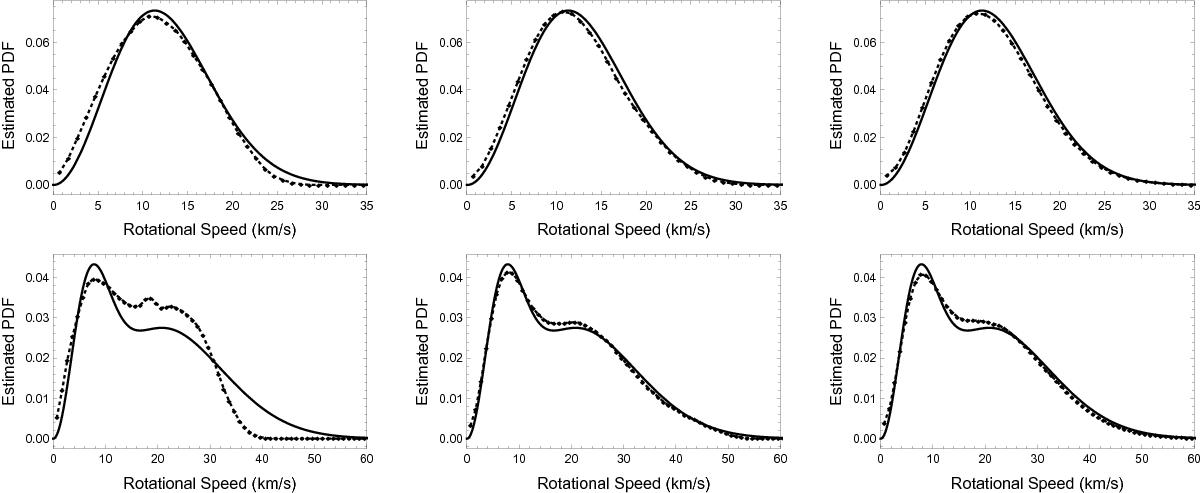
Upper panels: univariate Maxwellian distribution, with parameter σ = 8, is shown with a solid line in all upper panels; black squares connected by dashed lines represent the mean of the nMC = 1000 samples of Tikhonov regularization. Results are for: ns = 30 with σϵ = 0.5 (upper left), ns = 100 with σϵ = 1 (upper center) and ns = 1000 with σϵ = 2 (upper right). Lower panels: bivariate Maxwellian distributions are shown by a solid line in all lower panels, with parameters σ1 = 5 and σ2 = 15 and amplitudes A = 0.7 and B = 0.3. Black squares connected by a dashed line show the estimated PDFs obtained by Tikhonov regularization. Results are for: ns = 30 with σϵ = 0.5 (lower left), ns = 300 with σϵ = 1 (lower center) and ns = 1000 with σϵ = 2 (lower right).
Current usage metrics show cumulative count of Article Views (full-text article views including HTML views, PDF and ePub downloads, according to the available data) and Abstracts Views on Vision4Press platform.
Data correspond to usage on the plateform after 2015. The current usage metrics is available 48-96 hours after online publication and is updated daily on week days.
Initial download of the metrics may take a while.