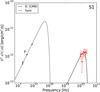
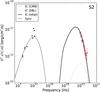
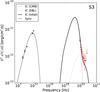
Fig. 7
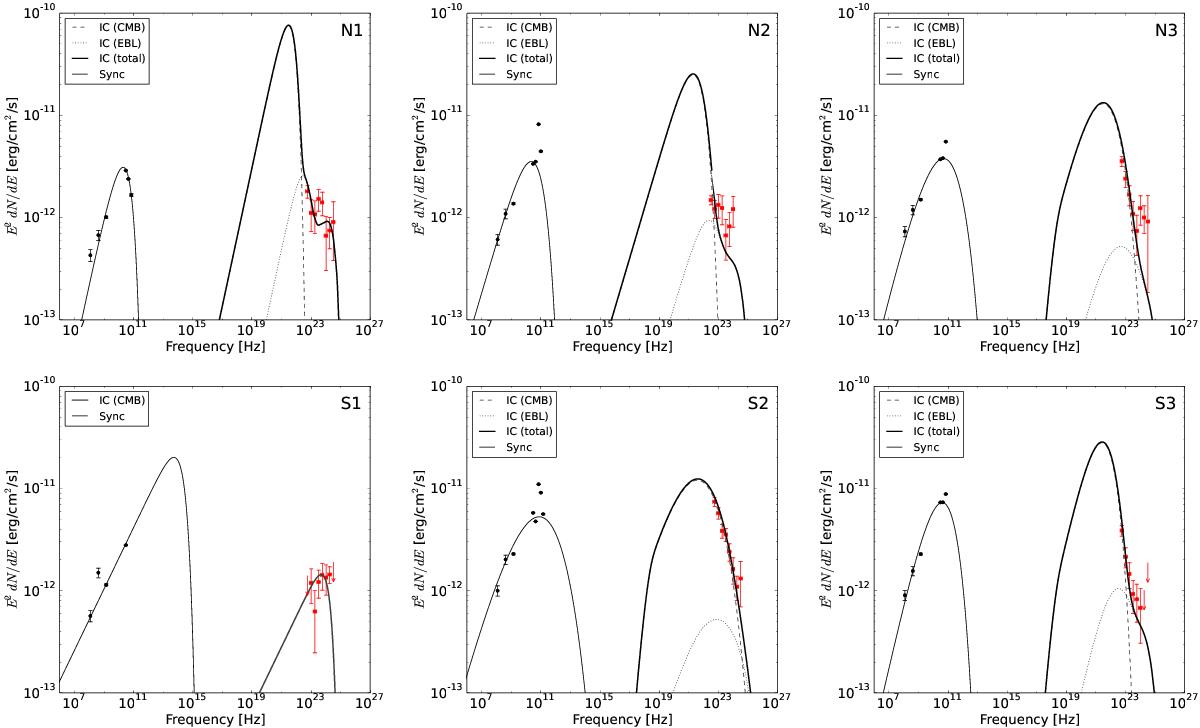
Broadband SEDs for each region shown in Fig. 3. Observed radio and Planck data (black dots with error bars) are fitted with a synchrotron model. Observed Fermi-LAT data (red dots with error bars) are fitted with the inverse-Compton (IC) scatterings of the CMB and EBL photon fields except for S1, which only requires the seed photon contribution from the CMB. The upper limits are calculated within a 3σ confidence level.
Current usage metrics show cumulative count of Article Views (full-text article views including HTML views, PDF and ePub downloads, according to the available data) and Abstracts Views on Vision4Press platform.
Data correspond to usage on the plateform after 2015. The current usage metrics is available 48-96 hours after online publication and is updated daily on week days.
Initial download of the metrics may take a while.