Free Access
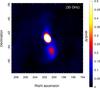
Fig. 5
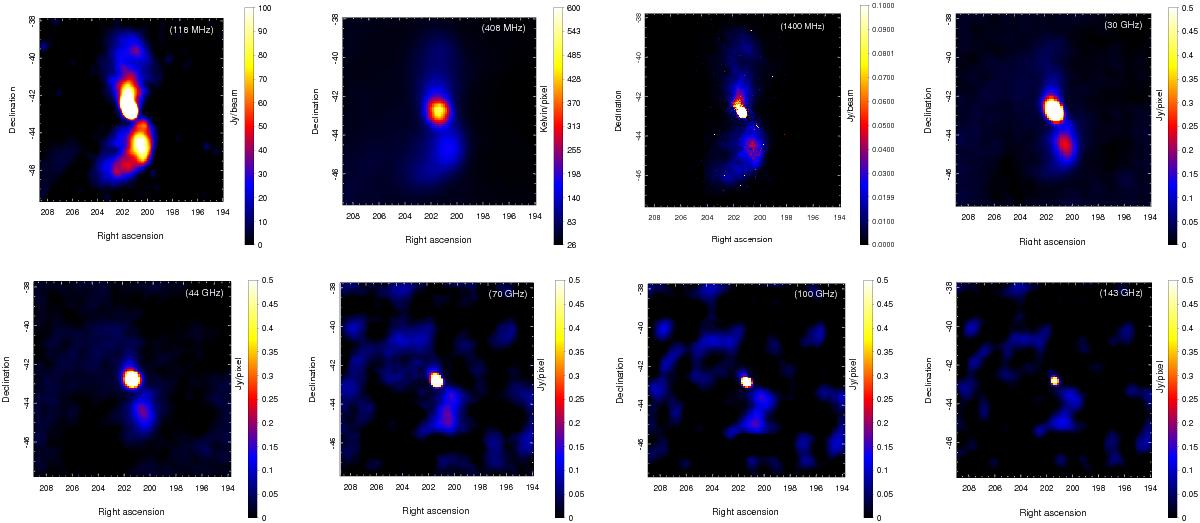
From top left to bottom right: radio/microwave images of the Cen A and surrounding field at 118, 408, 1400 MHz, 30, 44, 70, 100, and 143 GHz. The Planck maps are cleaned maps, which are used to measure the flux densities (see Sect. 3.3 in details). These images are smoothed using a Gaussian kernel 0.3°.
This figure is made of several images, please see below:
Current usage metrics show cumulative count of Article Views (full-text article views including HTML views, PDF and ePub downloads, according to the available data) and Abstracts Views on Vision4Press platform.
Data correspond to usage on the plateform after 2015. The current usage metrics is available 48-96 hours after online publication and is updated daily on week days.
Initial download of the metrics may take a while.