Free Access
Fig. 4
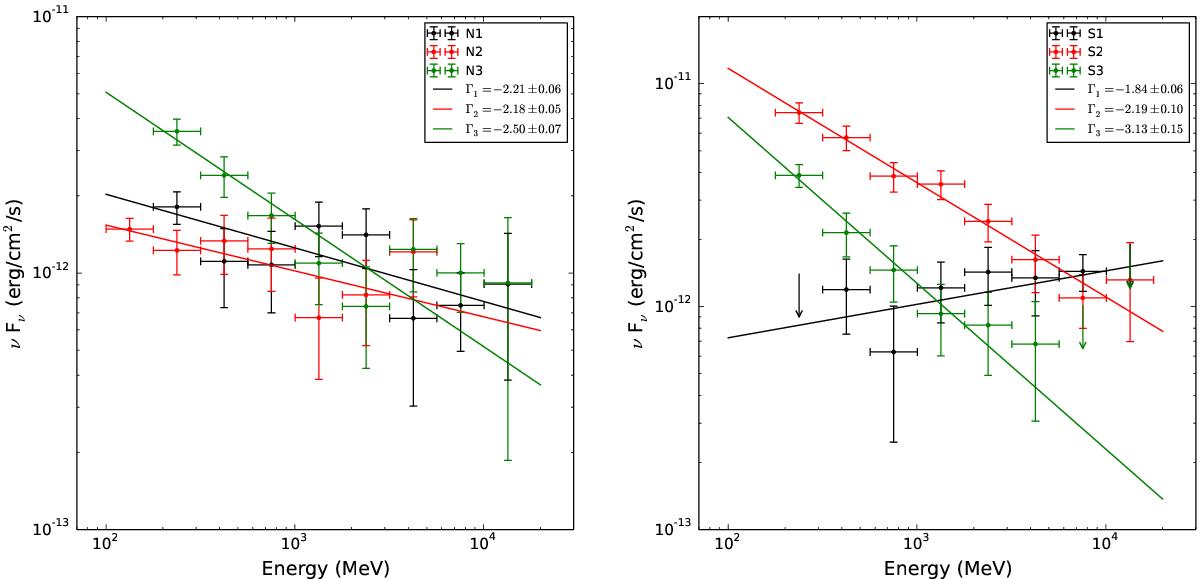
Left plot SEDs of the slices in the north lobe. Right plot SEDs of the slices in the south lobe. The solid lines indicate the power-law fits. Γ1, Γ2, and Γ3 are the corresponding photon indices.
This figure is made of several images, please see below:
Current usage metrics show cumulative count of Article Views (full-text article views including HTML views, PDF and ePub downloads, according to the available data) and Abstracts Views on Vision4Press platform.
Data correspond to usage on the plateform after 2015. The current usage metrics is available 48-96 hours after online publication and is updated daily on week days.
Initial download of the metrics may take a while.