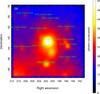
Fig. 1
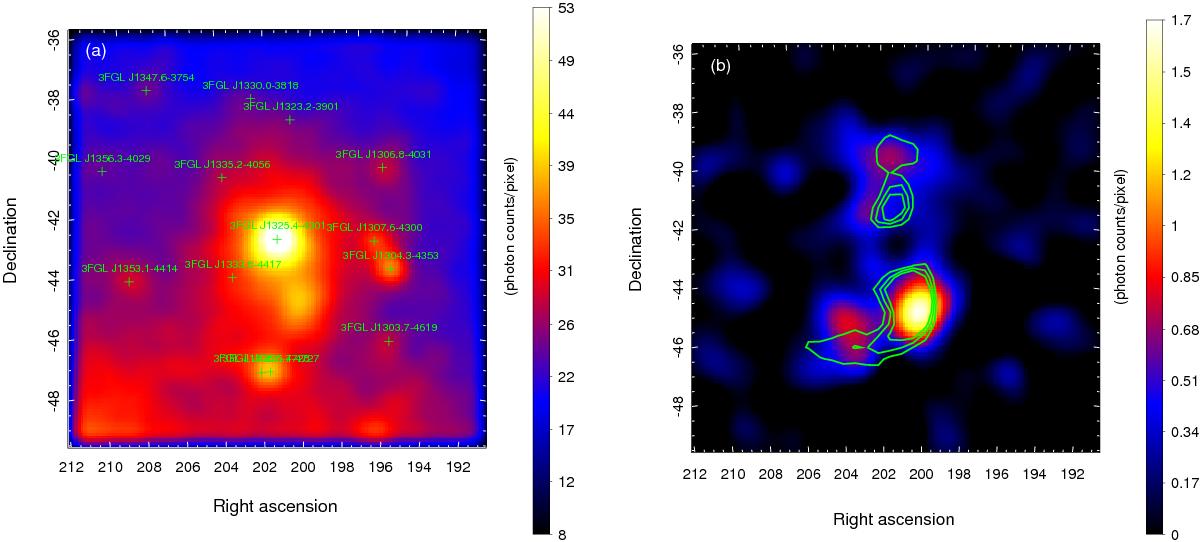
a) LAT counts map of the 14° × 14° ROI. The counts map is smoothed with a Gaussian of kernel 0.7°. The green crosses indicate the position of the point-like sources within 7° of Cen A. b) Residual maps of lobes after subtracting the diffuse background, the point-like sources, and the Cen A core. The green contours indicate Planck 30 GHz lobe contours.
Current usage metrics show cumulative count of Article Views (full-text article views including HTML views, PDF and ePub downloads, according to the available data) and Abstracts Views on Vision4Press platform.
Data correspond to usage on the plateform after 2015. The current usage metrics is available 48-96 hours after online publication and is updated daily on week days.
Initial download of the metrics may take a while.