Fig. 8
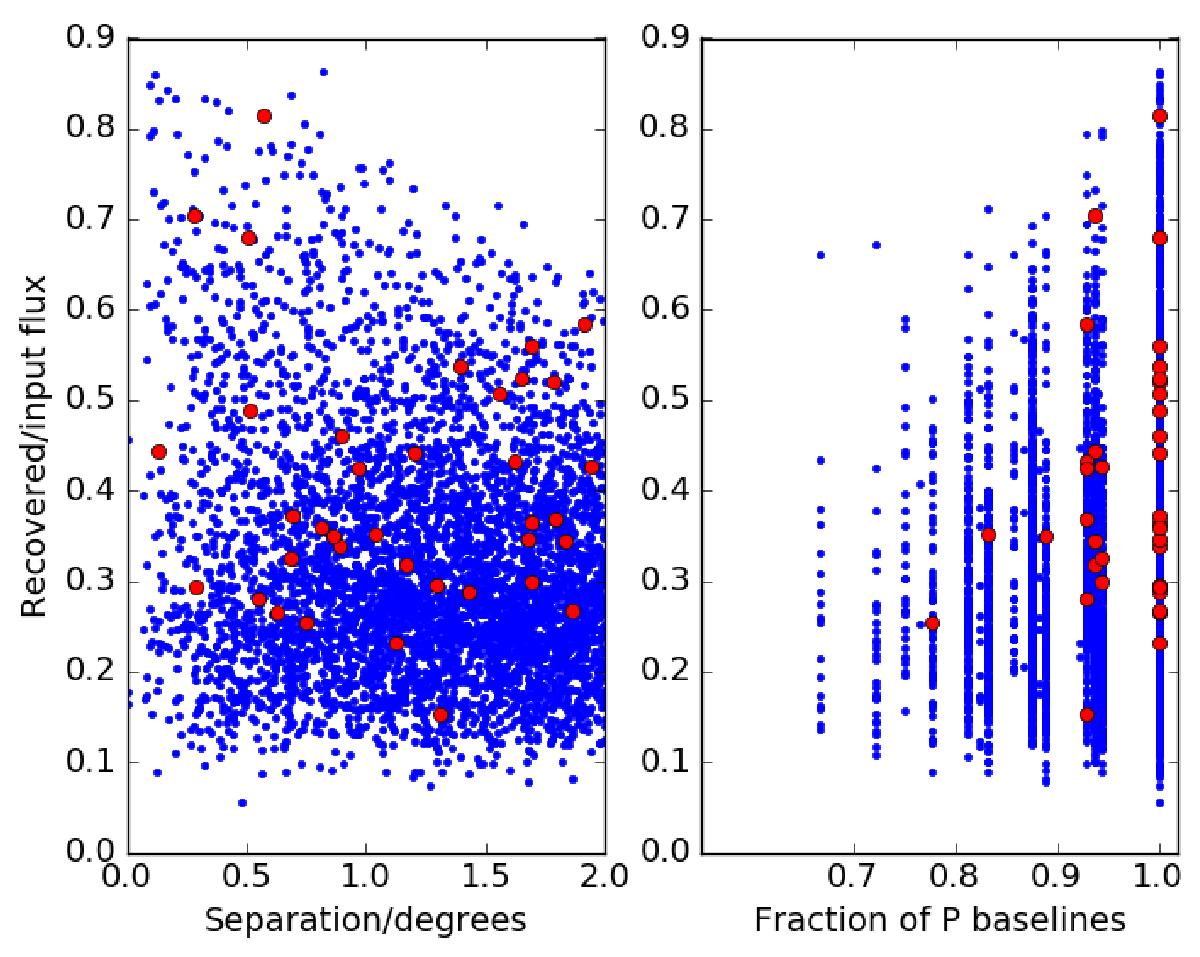
Plots of the flux decrement, which is the maximum flux density observed for a source of unit amplitude that has been corrupted by phase and delay solution transfer from one of a pair of LBCS sources to the other (see text). Left panel: flux decrement against separation of the sources. Right panel: flux decrement against percentage of baselines to ST001 with clear source detections. In both cases the red circles indicate those cases where both LBCS sources in a given pair are also JVAS sources.
Current usage metrics show cumulative count of Article Views (full-text article views including HTML views, PDF and ePub downloads, according to the available data) and Abstracts Views on Vision4Press platform.
Data correspond to usage on the plateform after 2015. The current usage metrics is available 48-96 hours after online publication and is updated daily on week days.
Initial download of the metrics may take a while.