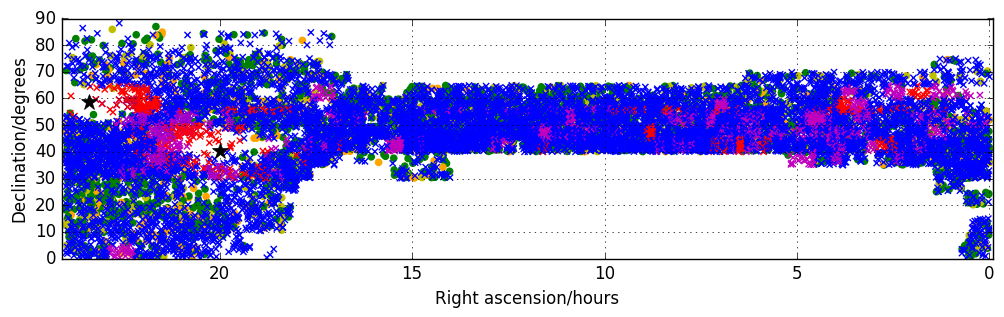
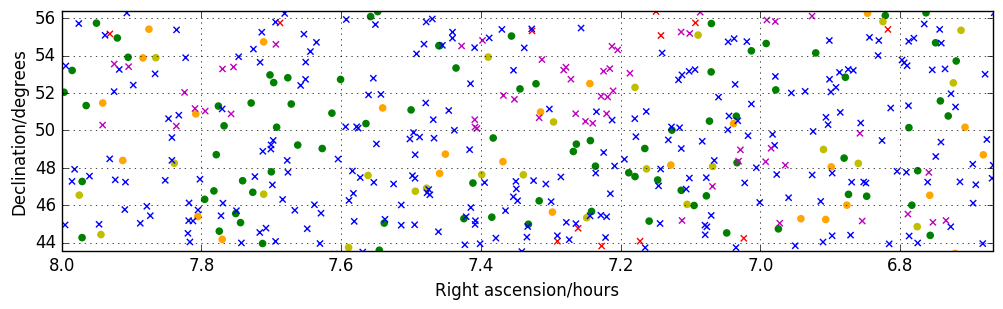
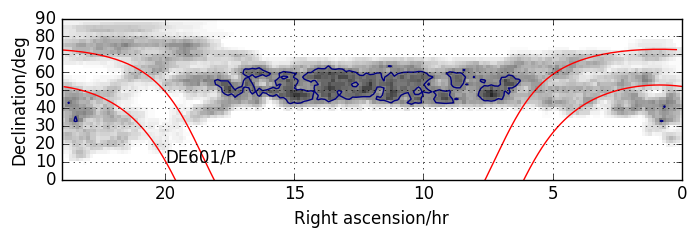
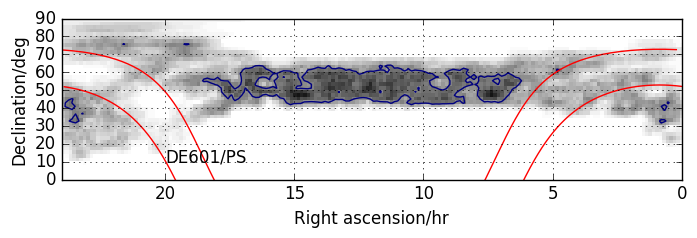
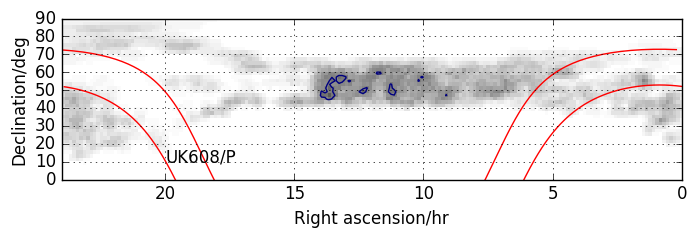
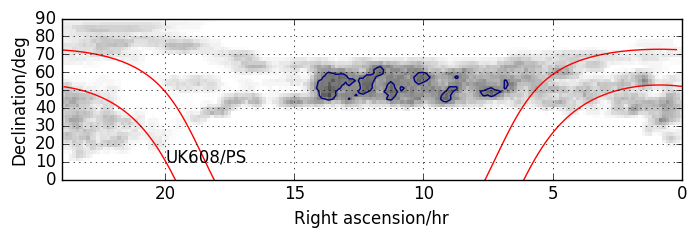
Fig. 6
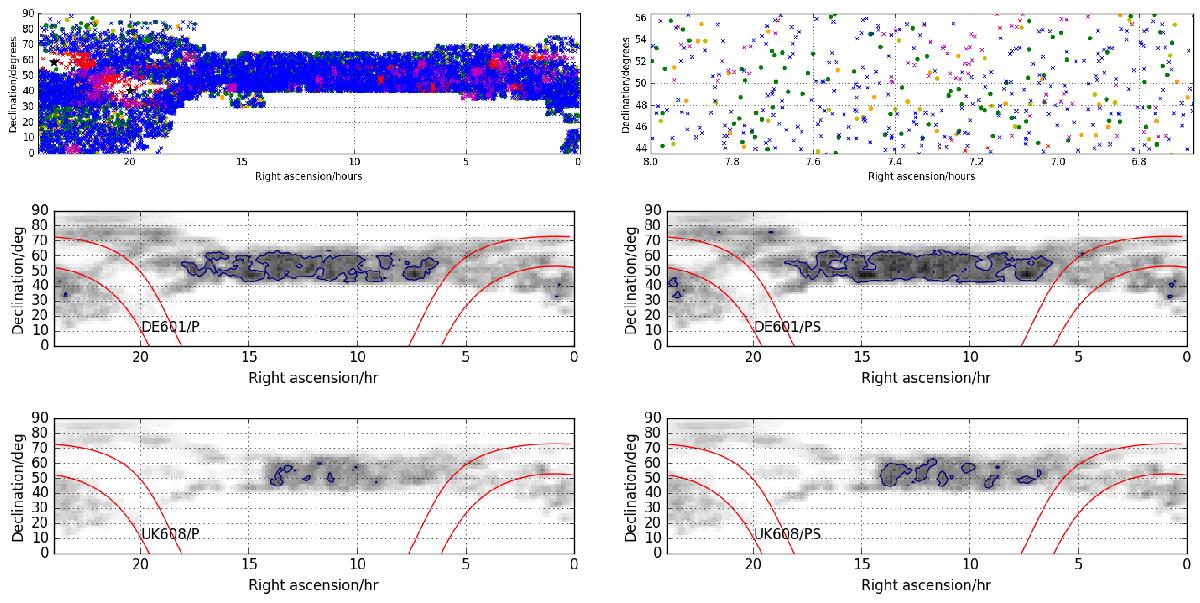
Top left: current sky coverage of LBCS. Over subsequent observing seasons, the intention is to fill in gaps or areas where the observations were poor (see Sect. 3.6), as well as to extend the survey below 30°N by selection from the MSSS survey. Top right: an expanded plot of a small region of sky. In both plots, green circles represent sources for which all, or all but one, observing stations gave P-class delay and phase solutions; greenish-yellow circles those for which all but one station gave P- or S-class solutions; and orange circles those for which all but two stations gave P- or S-class solutions. Blue crosses represent sources where the sources are likely not to be suitable as long-baseline calibrators. Purple and red crosses, respectively, represent the cases that are not detected on long baselines but the data is possibly, or definitely, faulty. Middle/lower: contour plots of average density of calibrators, greyscaled from 0−2 per sq. deg and with a contour at 1 per sq. deg. Middle: calibrators with correlated flux density between Effelsberg (DE601) and the phased core (ST001). Lower: the same for Chilbolton (UK608). In each case, the left-hand plot represents the density of good (“P”) calibrators and the right-hand plot the density of good or marginal calibrators. The red lines in each plot represent Galactic latitude of ± 10°.
Current usage metrics show cumulative count of Article Views (full-text article views including HTML views, PDF and ePub downloads, according to the available data) and Abstracts Views on Vision4Press platform.
Data correspond to usage on the plateform after 2015. The current usage metrics is available 48-96 hours after online publication and is updated daily on week days.
Initial download of the metrics may take a while.