Fig. 5
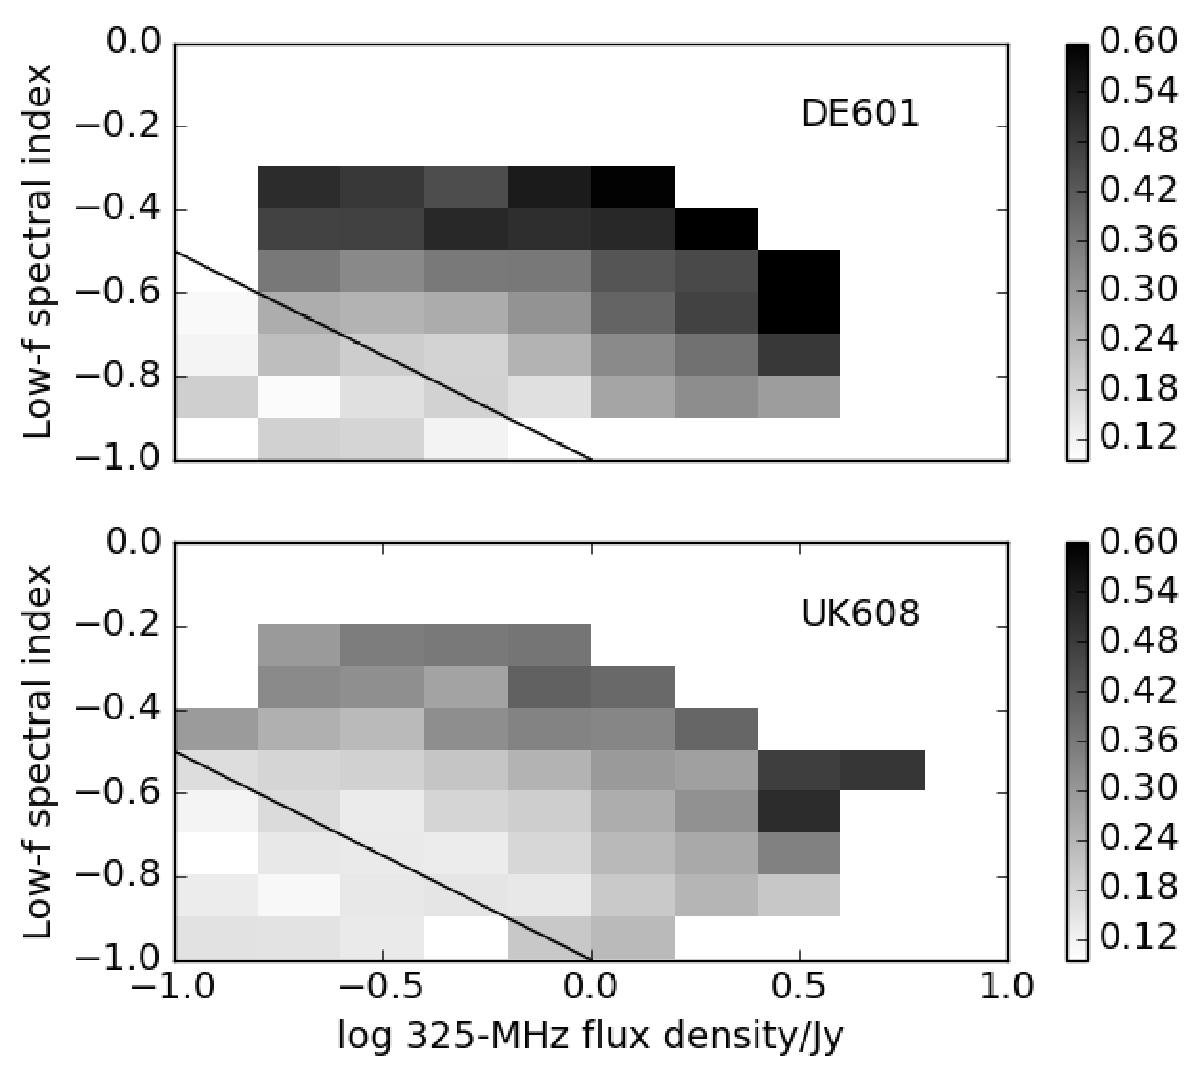
Greyscale plot of the high signal-to-noise (category “P”) detection fraction as a function of WENSS 325-MHz flux density and low-frequency spectral index. The latter quantity is calculated from WENSS together with the VLSS 74-MHz flux density and, where available the 6C 151-MHz flux density (Hales et al. 1993, and references therein). The upper plot represents the detections on a 266-km baseline, and the lower plot shows the detections on a 602-km baseline. Both these lengths are maximum projected baseline length, and in practice the projected baseline length will be less than this. Pixels with errors smaller than 0.1 are plotted. The line in each case represents g = 0; in practice, the survey should be complete to g = 0.096. A few objects with g< 0 were observed, mostly because their MSSS flux densities indicated they might have a flat low-frequency spectrum.
Current usage metrics show cumulative count of Article Views (full-text article views including HTML views, PDF and ePub downloads, according to the available data) and Abstracts Views on Vision4Press platform.
Data correspond to usage on the plateform after 2015. The current usage metrics is available 48-96 hours after online publication and is updated daily on week days.
Initial download of the metrics may take a while.