Fig. 4
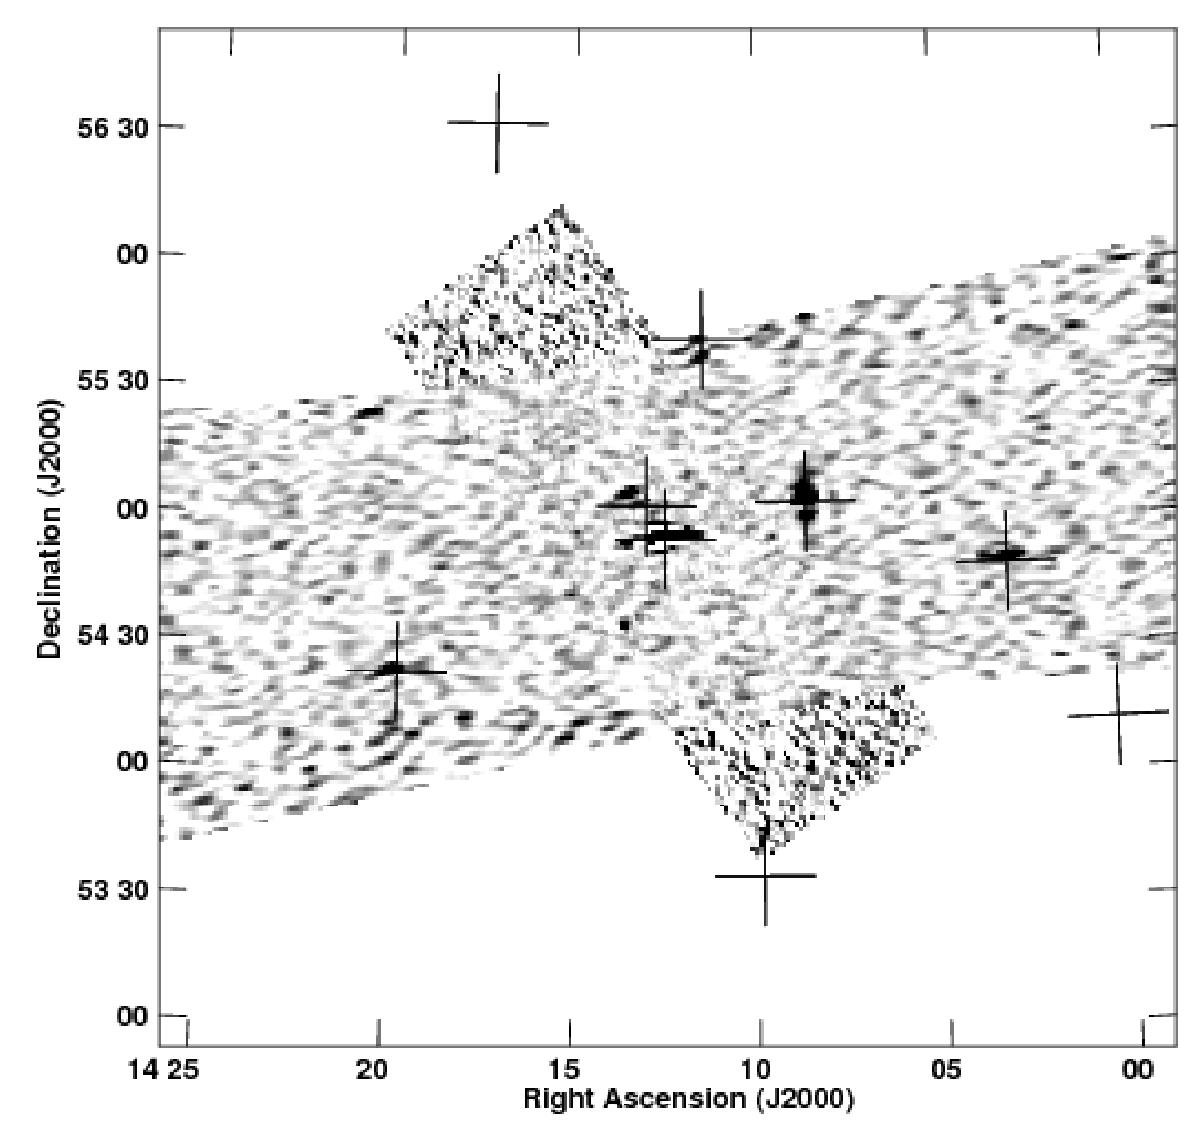
Fringe-rate and delay map of a source; this is an unusually crowded field, and many other maps show only the targeted source. Each superposed parallelogram is the FRD map generated from an individual baseline to ST001, with the larger fields of view corresponding to the shorter baselines. The target source is clearly visible in the field, showing that it has compact structure, and in addition other sources are seen in the field which are also seen in the WENSS survey. All WENSS sources with flux density >400 mJy are shown by crosses.
Current usage metrics show cumulative count of Article Views (full-text article views including HTML views, PDF and ePub downloads, according to the available data) and Abstracts Views on Vision4Press platform.
Data correspond to usage on the plateform after 2015. The current usage metrics is available 48-96 hours after online publication and is updated daily on week days.
Initial download of the metrics may take a while.