Fig. 3
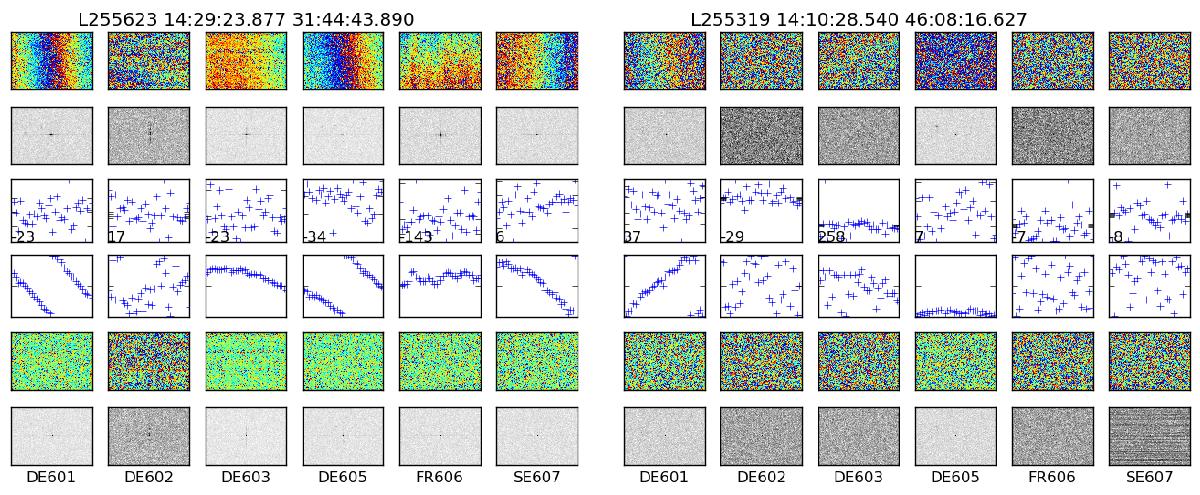
Graphics from two typical detected sources, from the 2014 December 18 observations. On the left is the source J142923+314443, which is clearly detected on all stations. The columns in the diagram represent the individual telescopes (see Table 1 for a list). The first row shows the phases in the data on the baseline between each station and the large tied station, plotted on a diagram whose abscissa represents increasing time and whose ordinate represents increasing frequency. The effect of ionospheric phase variation can be seen in the form of a phase change with time, particularly in DE601 and DE605 where one complete rotation is achieved in 4 min. The delay appears as a variation of phase with frequency, which here is quite moderate. The second row shows the Fourier transform of the images in the first row, clearly indicating the presence of a single compact source. DE602 was noisy during these observations, but nevertheless demonstrates that strong sources can be recovered. On the third and fourth rows, the delay and phase solutions are shown; the ticks on the y axis represent (−50 ns, −20 ns, 0, +20 ns and +50 ns) from the median delay (which is indicated, in nanoseconds, by the number on each plot). The phase solutions in the fourth row are plotted in the range −180° to + 180°. The final two rows show the corrected data after the fringe fit and its Fourier transform; the residuals include a number of small phase jumps. On the right, the source J141028+460816 is shown. Here the source is clearly seen on the short baselines from the tied station in the Netherlands to DE601 and DE605, but the source is not suitable as a calibrator for the longer baselines.
Current usage metrics show cumulative count of Article Views (full-text article views including HTML views, PDF and ePub downloads, according to the available data) and Abstracts Views on Vision4Press platform.
Data correspond to usage on the plateform after 2015. The current usage metrics is available 48-96 hours after online publication and is updated daily on week days.
Initial download of the metrics may take a while.