Fig. 6
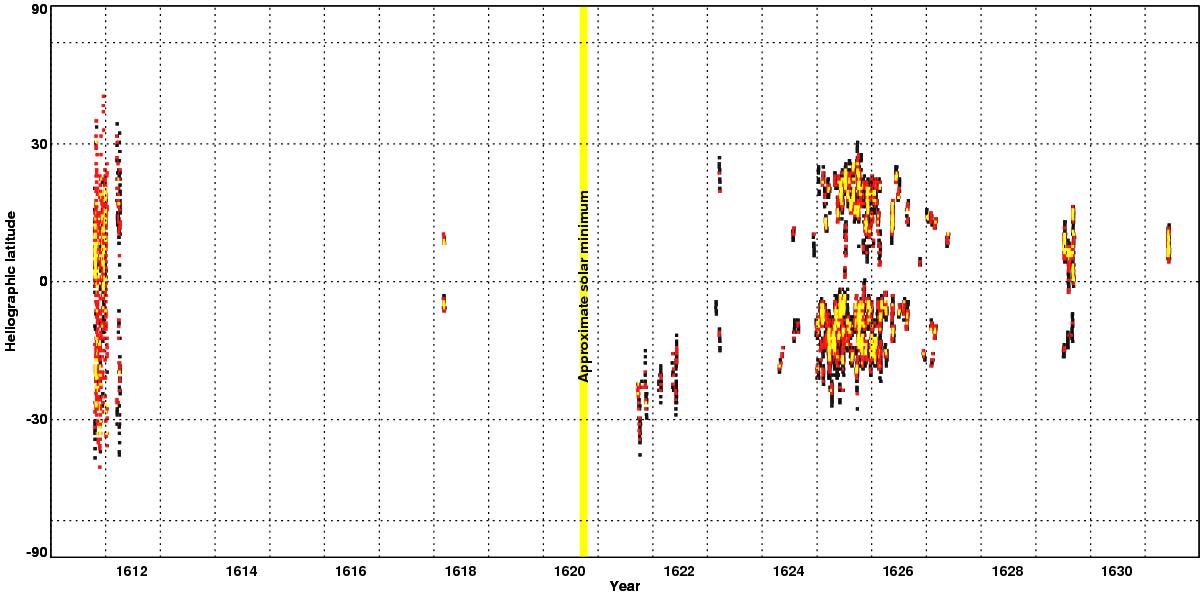
Butterfly diagram of the sunspot positions obtained from the observations by Christoph Scheiner and his colleagues. The ordinate is linear in sinλ. The umbral areas of the individual spots are used to weight the increments accumulating in each time and latitude bin. The approximate activity minimum is the time recently inferred by Neuhäuser & Neuhäuser (2016).
Current usage metrics show cumulative count of Article Views (full-text article views including HTML views, PDF and ePub downloads, according to the available data) and Abstracts Views on Vision4Press platform.
Data correspond to usage on the plateform after 2015. The current usage metrics is available 48-96 hours after online publication and is updated daily on week days.
Initial download of the metrics may take a while.