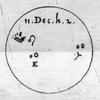
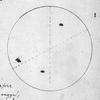
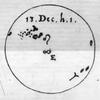
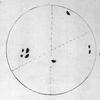
Fig. 4

Comparison of the drawings by Scheiner (left) and Harriot (right) on the two days they have common observations. The top row shows the observations of 1611 December 11, at 14 h (left) and at 10 h (right). The bottom row is of 1611 December 13, at 13 h (left) and at 8:30 h (right). The vertical dashed lines in Harriot’s drawings denote the (observed) direction to the zenith, the other dashed lines are the (computed) ecliptic.
Current usage metrics show cumulative count of Article Views (full-text article views including HTML views, PDF and ePub downloads, according to the available data) and Abstracts Views on Vision4Press platform.
Data correspond to usage on the plateform after 2015. The current usage metrics is available 48-96 hours after online publication and is updated daily on week days.
Initial download of the metrics may take a while.