Free Access
Fig. 9
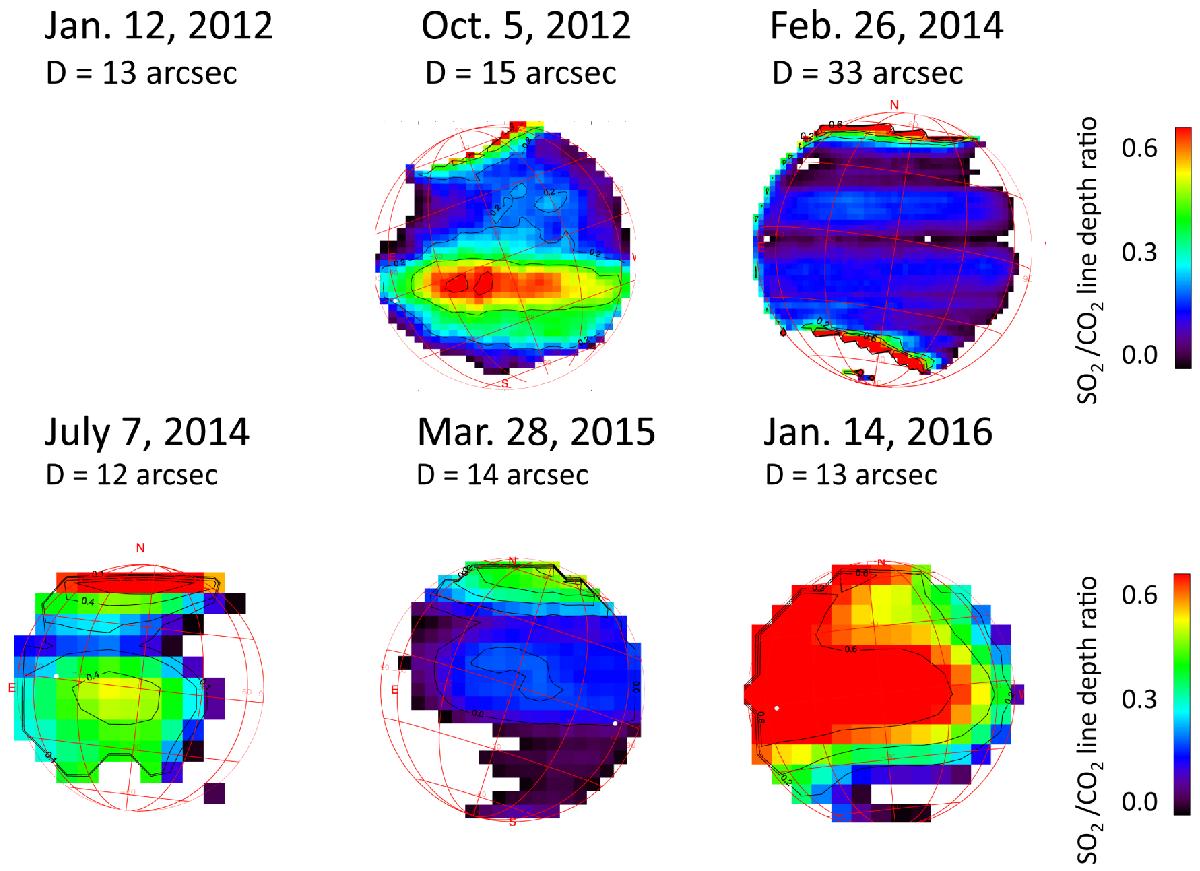
Example maps of the line depth ratio of a weak SO2 multiplet at 529.33 cm-1 (18.9 μm) divided by a weak CO2 transition at 529.26 cm-1, recorded during each of the TEXES observing runs. The scale is the same for the six maps. The exact dates and durations of the maps are indicated in Table 2.
Current usage metrics show cumulative count of Article Views (full-text article views including HTML views, PDF and ePub downloads, according to the available data) and Abstracts Views on Vision4Press platform.
Data correspond to usage on the plateform after 2015. The current usage metrics is available 48-96 hours after online publication and is updated daily on week days.
Initial download of the metrics may take a while.