Free Access
Fig. 6
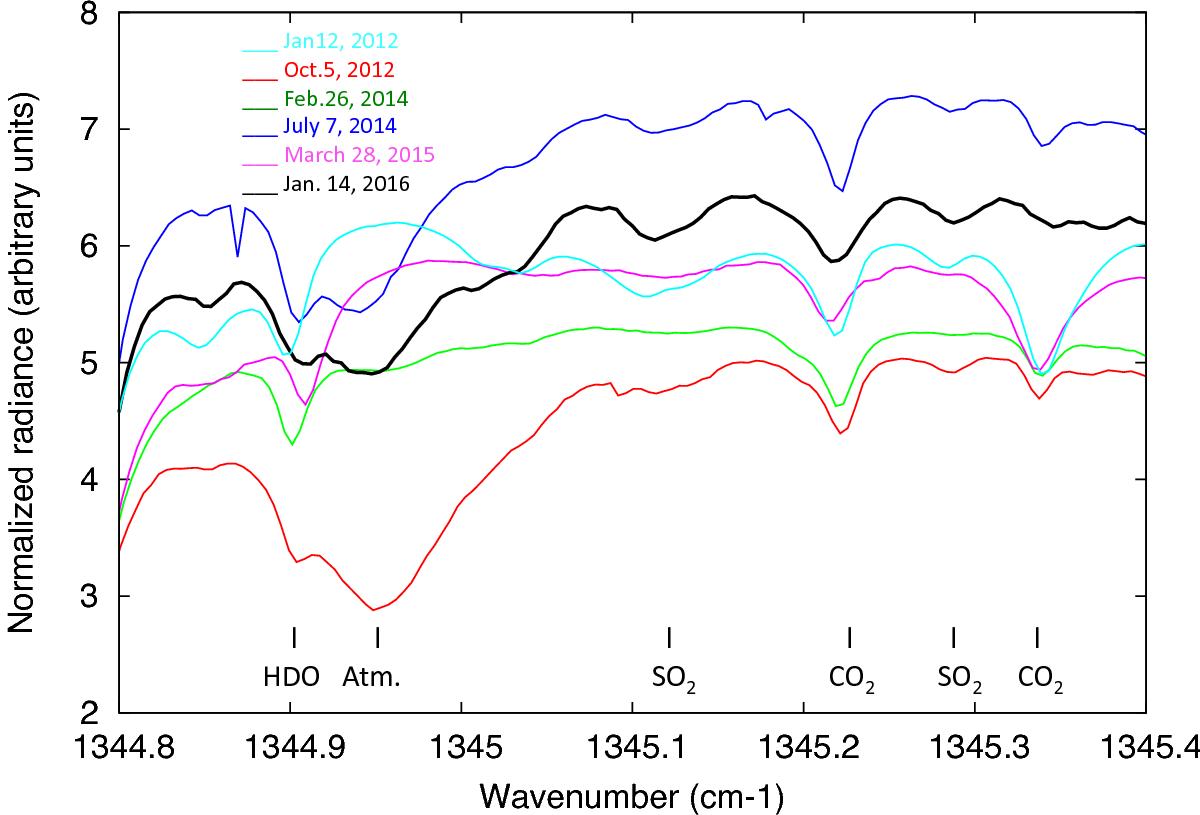
Examples of disk-integrated spectra recorded during each of the TEXES observing runs between 1344.8 and 1345.4 cm-1 (7.4 μm). The exact dates and durations of the corresponding observations are indicated in Table 2. It can be seen that the SO2 absorption bands are strongest in January 2016, and weakest in February 2014.
Current usage metrics show cumulative count of Article Views (full-text article views including HTML views, PDF and ePub downloads, according to the available data) and Abstracts Views on Vision4Press platform.
Data correspond to usage on the plateform after 2015. The current usage metrics is available 48-96 hours after online publication and is updated daily on week days.
Initial download of the metrics may take a while.