Fig. 21
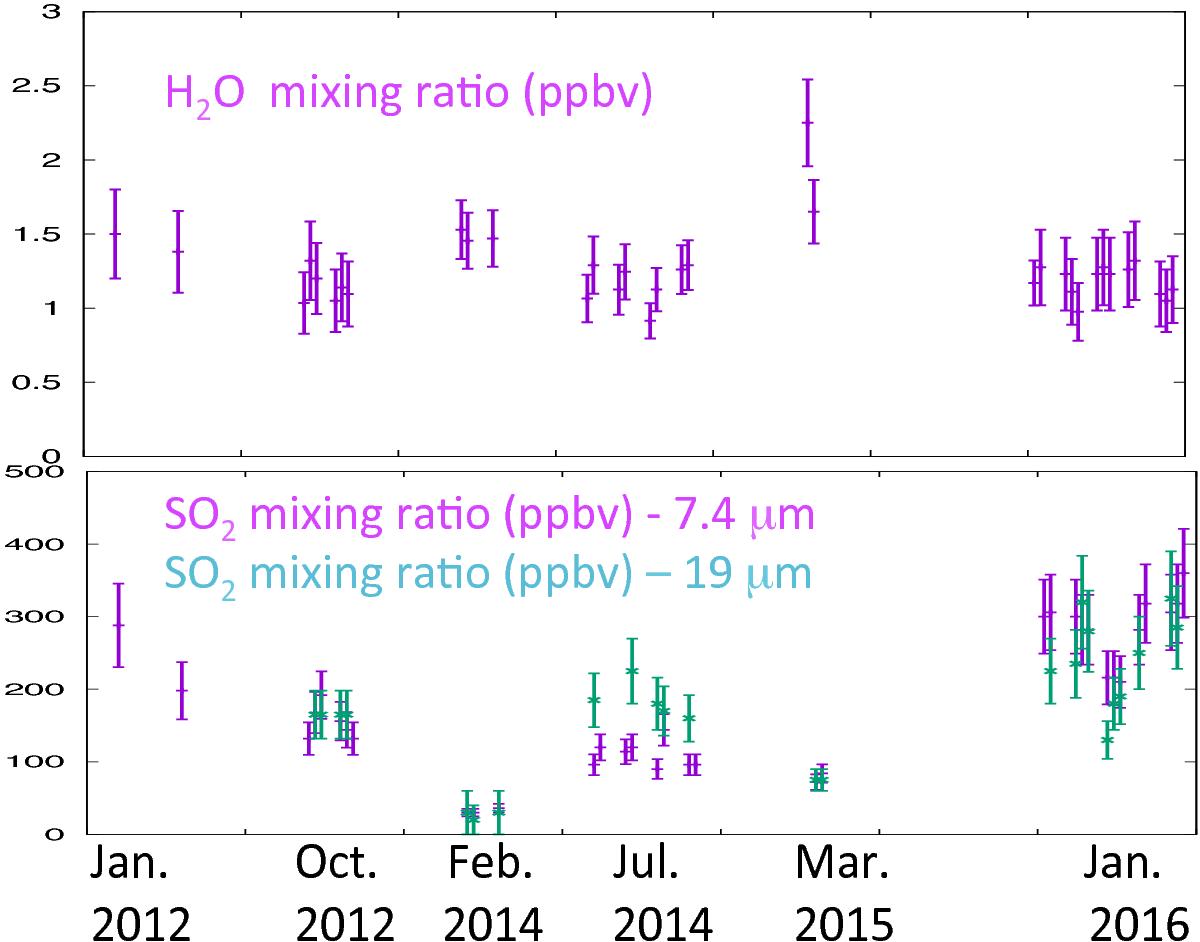
Long-term variations of the H2O volume mixing ratio (top, measured at 7.4 μm) and the SO2 volume mixing ratio (bottom, measured at 7.4 and 19 μm) between January 2012 and January 2016. The January 2012 and March dataset correspond to evening terminator observations; the 4 other datasets correspond to morning terminator observations. All data were obtained using the lines listed in Table 3, with the exception of the first HDO measurement (January 10, 2012) and the two 19-μm SO2 measurements of October 4, 2012, which were taken using different transitions (E12, E13). For the conversion from HDO to H2O abundances on Venus, we assume a D/H ratio of 200 times the VSMOW (Fedorova et al. 2008).
Current usage metrics show cumulative count of Article Views (full-text article views including HTML views, PDF and ePub downloads, according to the available data) and Abstracts Views on Vision4Press platform.
Data correspond to usage on the plateform after 2015. The current usage metrics is available 48-96 hours after online publication and is updated daily on week days.
Initial download of the metrics may take a while.