Fig. 20
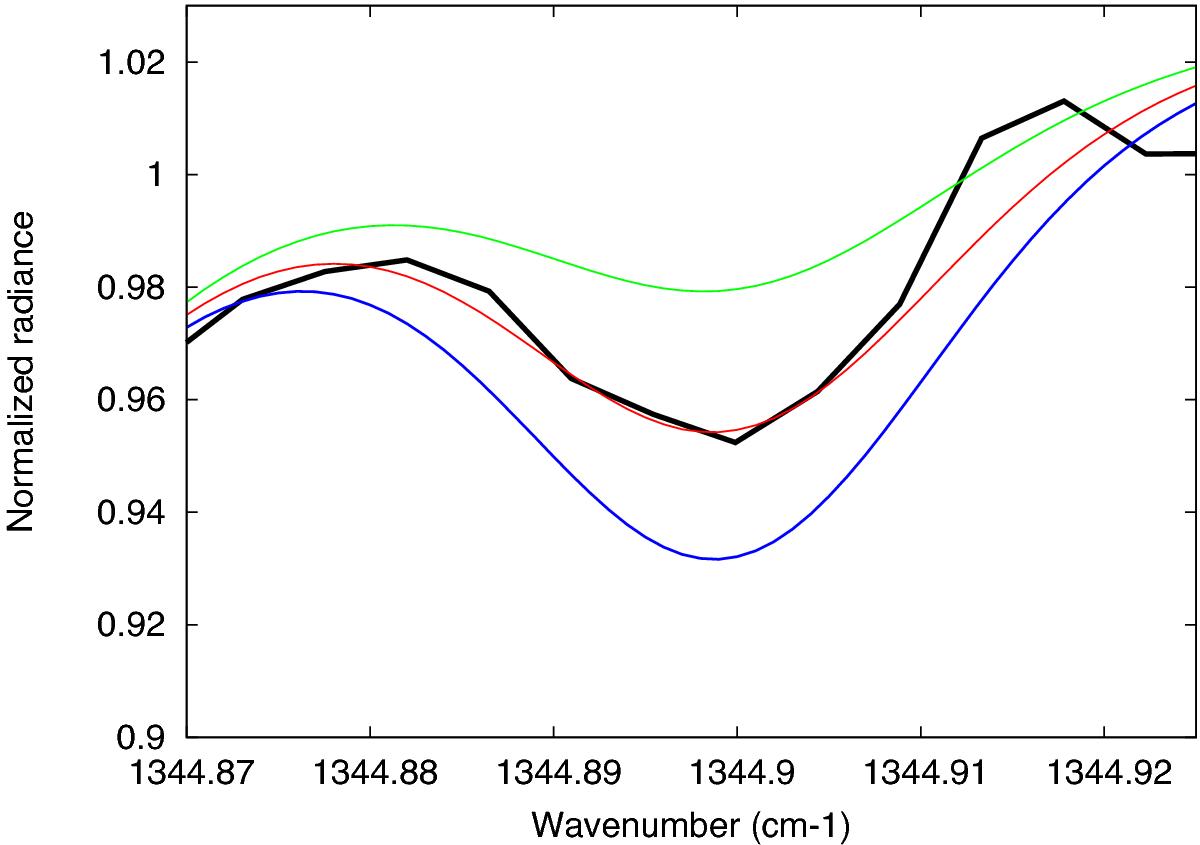
Disk-integrated spectrum of the HDO transition at 1344.90 cm-1 recorded by TEXES on January 14, 2016 (20:33 UT). The date and duration of the corresponding observation are indicated in Table 2. The January 2016 run corresponds to the strongest SO2 content measured at the cloudtop between 2012 and 2016. Thick black line: the TEXES data; thin lines: models. Green: H2O = 0.5 ppmv; red (best fit): H2O = 1.0 ppmv; blue: H2O = 1.5 ppmv. For the conversion between the HDO and H2O abundances on Venus, we assume a D/H ratio of 200 times the VSMOW (Fedorova et al. 2008).
Current usage metrics show cumulative count of Article Views (full-text article views including HTML views, PDF and ePub downloads, according to the available data) and Abstracts Views on Vision4Press platform.
Data correspond to usage on the plateform after 2015. The current usage metrics is available 48-96 hours after online publication and is updated daily on week days.
Initial download of the metrics may take a while.