Free Access
Fig. 18
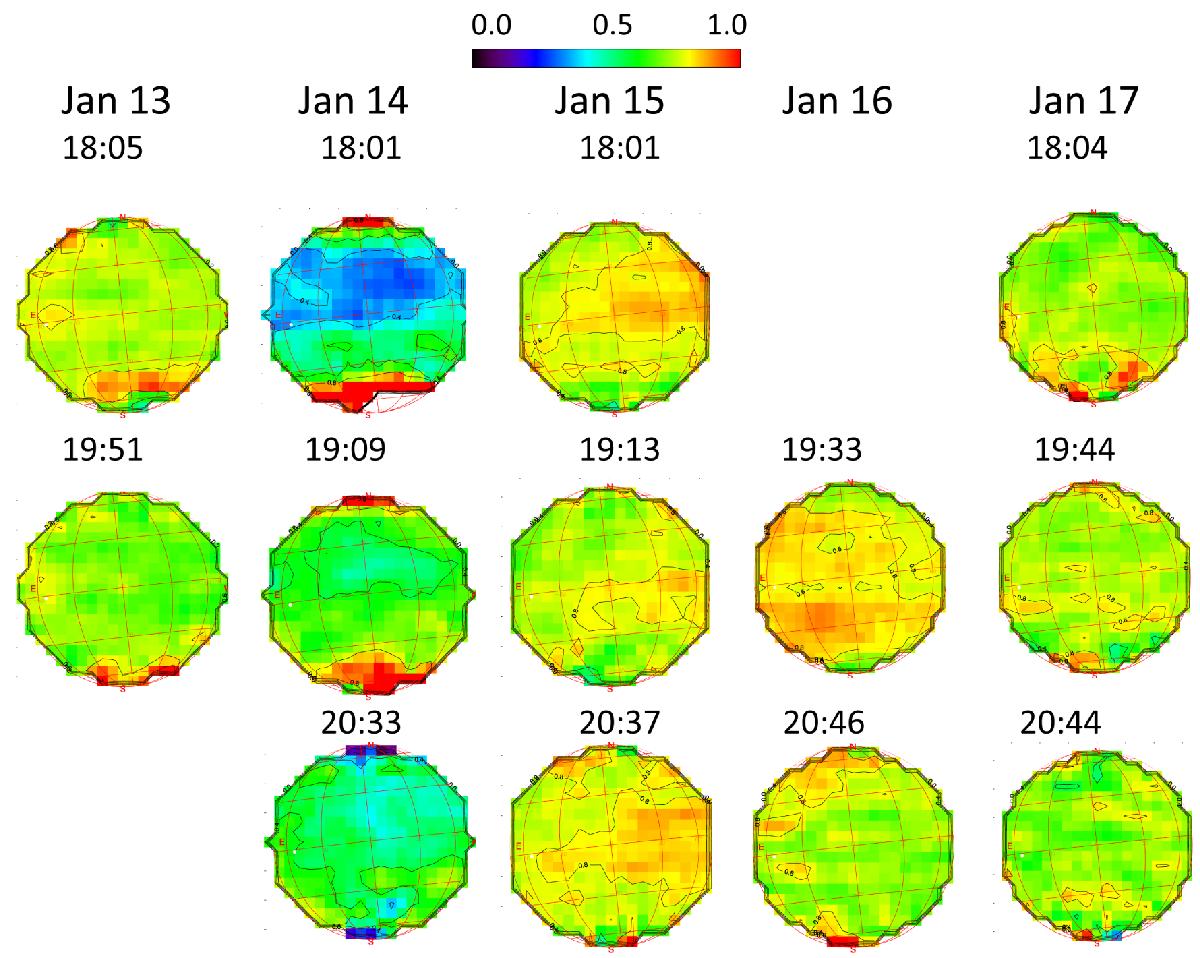
Maps of the line depth ratio of the HDO transition at 1344.90 cm-1 (7.4 μm) divided by a weak CO2 transition at 1345.22 cm-1, recorded with TEXES between January 13 and January 17, 2016. The data are the same as for Fig. 10. The scale is the same for all maps. The dates and durations of the maps are indicated in Table 2.
Current usage metrics show cumulative count of Article Views (full-text article views including HTML views, PDF and ePub downloads, according to the available data) and Abstracts Views on Vision4Press platform.
Data correspond to usage on the plateform after 2015. The current usage metrics is available 48-96 hours after online publication and is updated daily on week days.
Initial download of the metrics may take a while.