Fig. 13
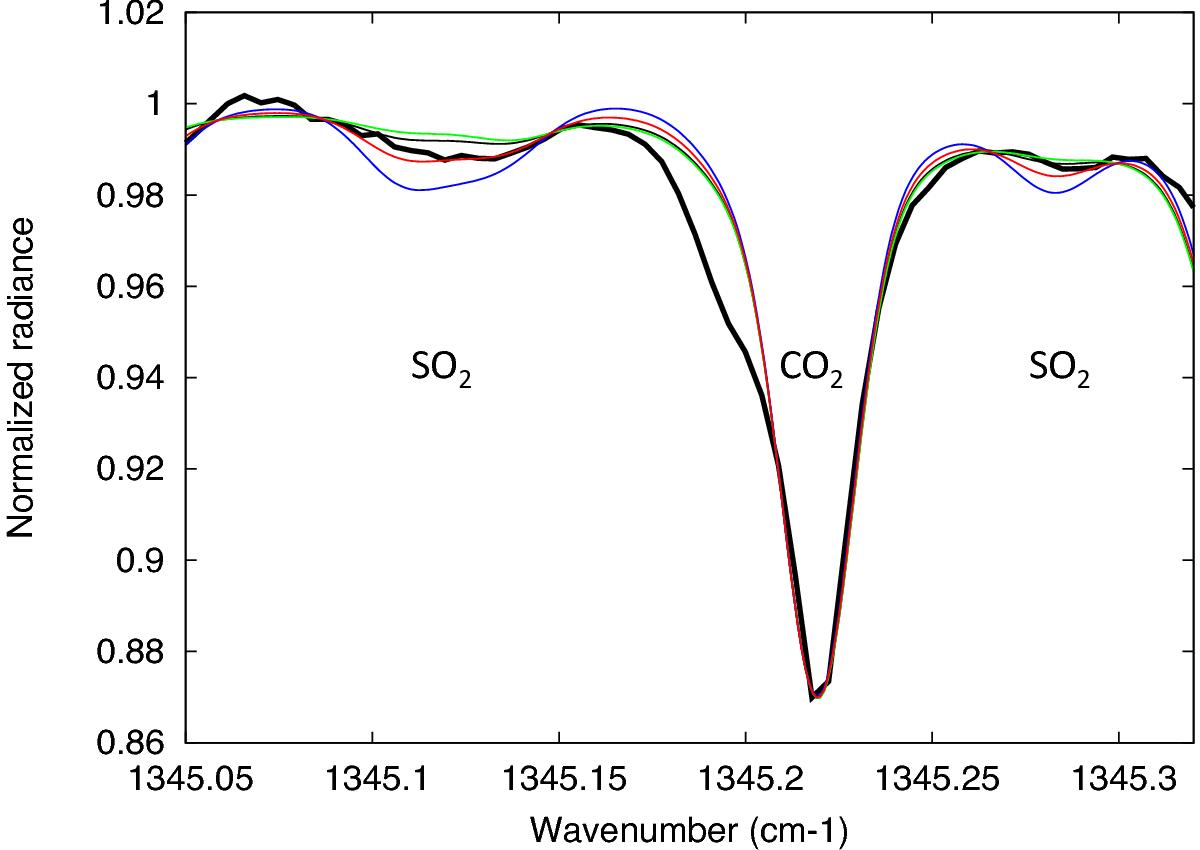
Disk-integrated spectrum recorded by TEXES on February 26, 2014, between 1345.05 and 1345.32 cm-1 (7.4 μm), showing weak transitions of CO2 and SO2. The date and duration of the corresponding observation are indicated in Table 2. The February 2014 run corresponds to the weakest SO2 content measured at the cloupdtop between 2012 and 2016. Thick black line: TEXES data; thin lines: models. Green: SO2 = 20 ppbv with cutoff; red (best fit): SO2 = 30 ppbv with cutoff; blue: SO2= 40 ppbv with cutoff; black: SO2 = 15 ppbv, constant with altitude. The spectral resolution is 0.024 cm-1.
Current usage metrics show cumulative count of Article Views (full-text article views including HTML views, PDF and ePub downloads, according to the available data) and Abstracts Views on Vision4Press platform.
Data correspond to usage on the plateform after 2015. The current usage metrics is available 48-96 hours after online publication and is updated daily on week days.
Initial download of the metrics may take a while.