Fig. 8
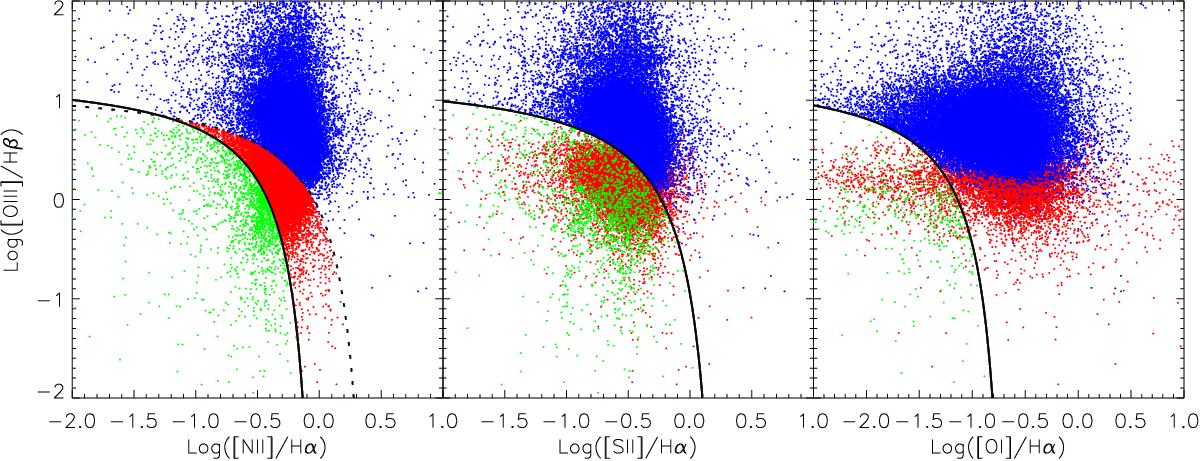
Pixel-by-pixel BPT diagrams of the filaments with MUSE. The black line in the left panel represents the empirical separation of star formation (green) and AGN/shock-ionised regions (blue). The dotted line on the left and the solid lines in the other panels show the extreme upper limit for star formation (Kewley et al. 2006). The red points correspond to the composite regime.
Current usage metrics show cumulative count of Article Views (full-text article views including HTML views, PDF and ePub downloads, according to the available data) and Abstracts Views on Vision4Press platform.
Data correspond to usage on the plateform after 2015. The current usage metrics is available 48-96 hours after online publication and is updated daily on week days.
Initial download of the metrics may take a while.