Fig. 7
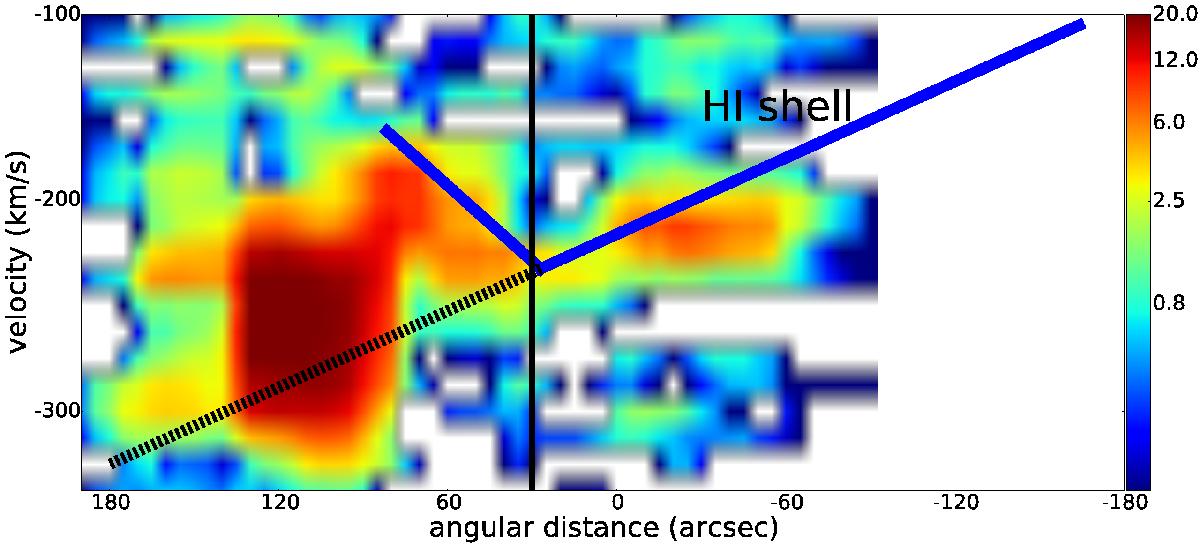
PV diagram of the CO emission (in mK) centred in α = 13h26m15s, δ = −42:49:00 over the same slit orientation as Oosterloo & Morganti (2005) with a width of 4.2′ (taking all the CO emission). The blue lines represent the H i cloud velocity gradient. The dashed line represents the continuity of this velocity gradient over the CO emission. The position of the radio jet is shown by the vertical black line.
Current usage metrics show cumulative count of Article Views (full-text article views including HTML views, PDF and ePub downloads, according to the available data) and Abstracts Views on Vision4Press platform.
Data correspond to usage on the plateform after 2015. The current usage metrics is available 48-96 hours after online publication and is updated daily on week days.
Initial download of the metrics may take a while.