Fig. 4
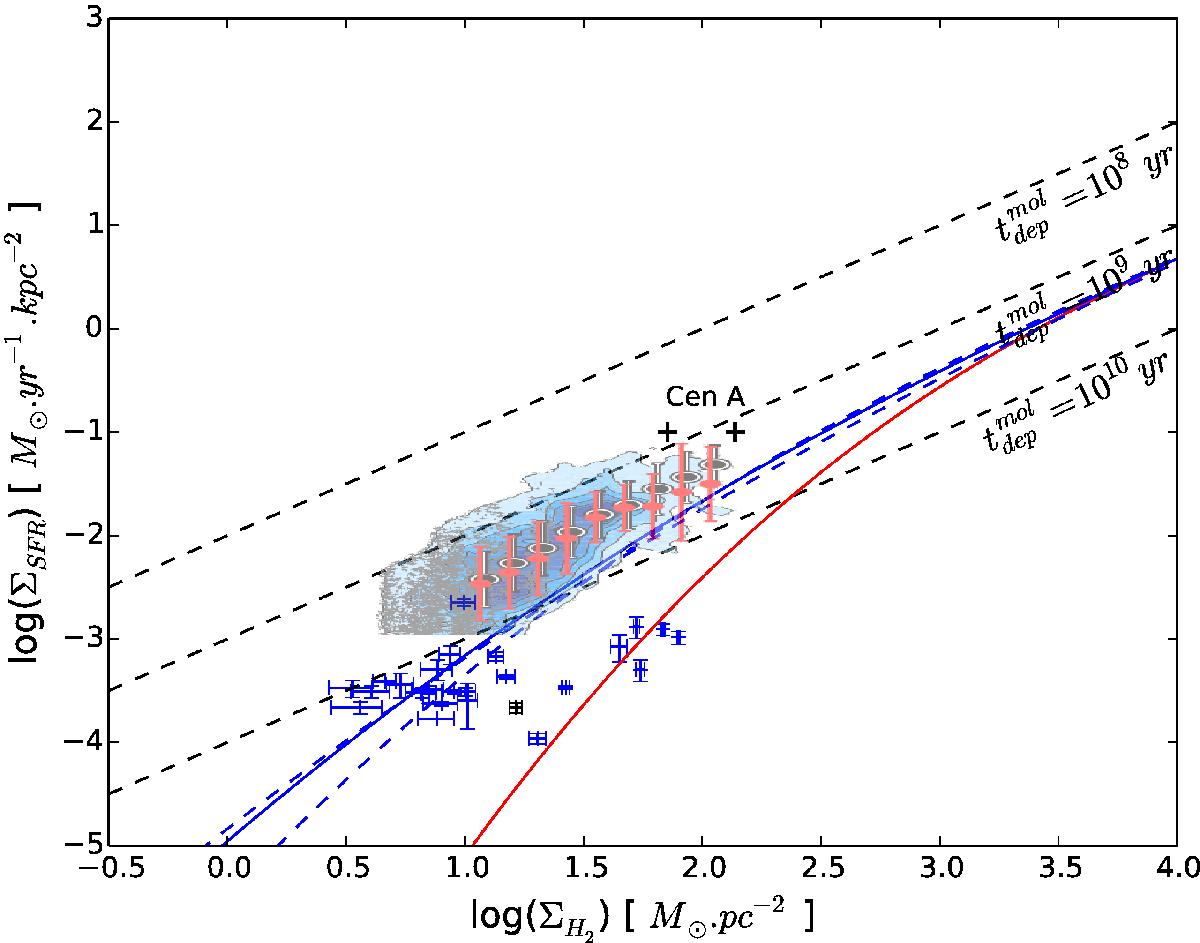
ΣSFR vs. ΣH2 for the different regions of CO emission observed with APEX (blue). The black crosses correspond to the central galaxy and the entire filaments (ΣH2 ~ 16.4M⊙pc-2; ΣSFR ~ 2.17 × 10⁻⁴ M⊙yr-1kpc-2). The diagonal dashed lines show lines of constant molecular gas depletion times of, from top to bottom, 108, 109, and 1010yr. We overlay the contours of Leroy et al. (2013) for nearby spiral galaxies. The red and blue lines represent Eq. (2) for the different set of parameters presented below.
Current usage metrics show cumulative count of Article Views (full-text article views including HTML views, PDF and ePub downloads, according to the available data) and Abstracts Views on Vision4Press platform.
Data correspond to usage on the plateform after 2015. The current usage metrics is available 48-96 hours after online publication and is updated daily on week days.
Initial download of the metrics may take a while.