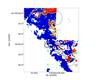
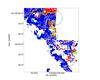
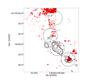
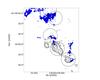
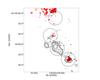
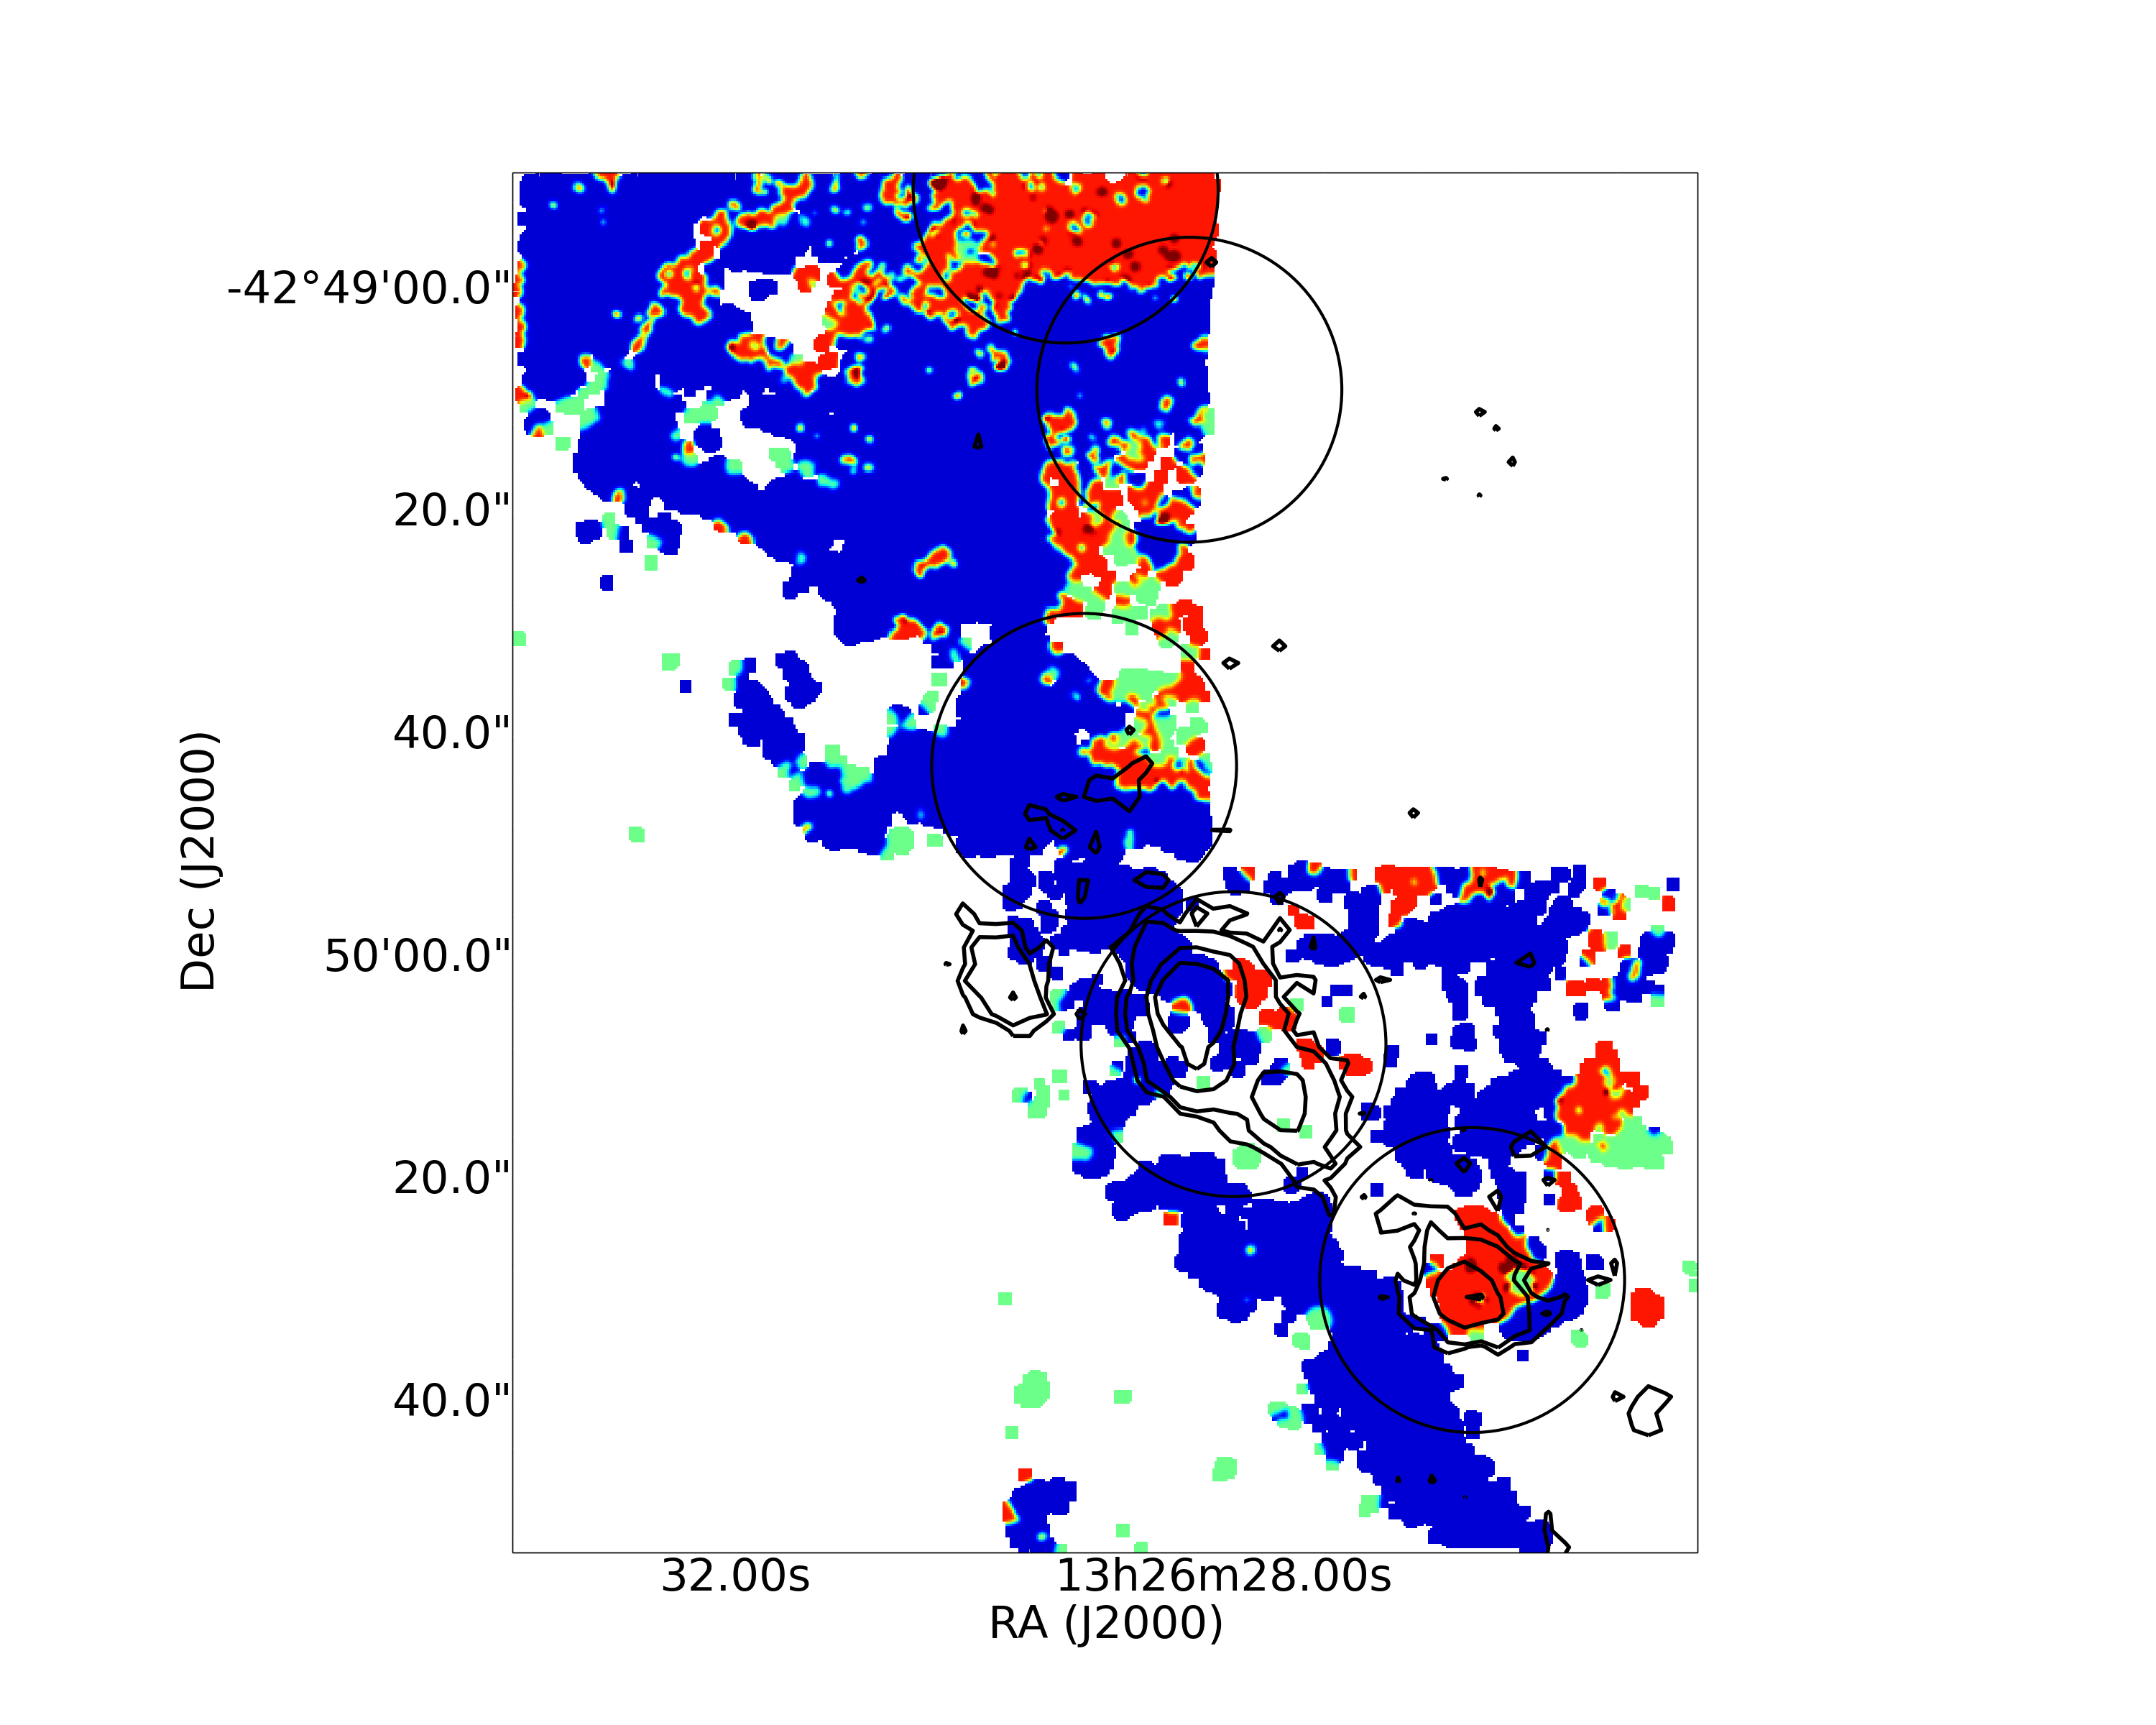
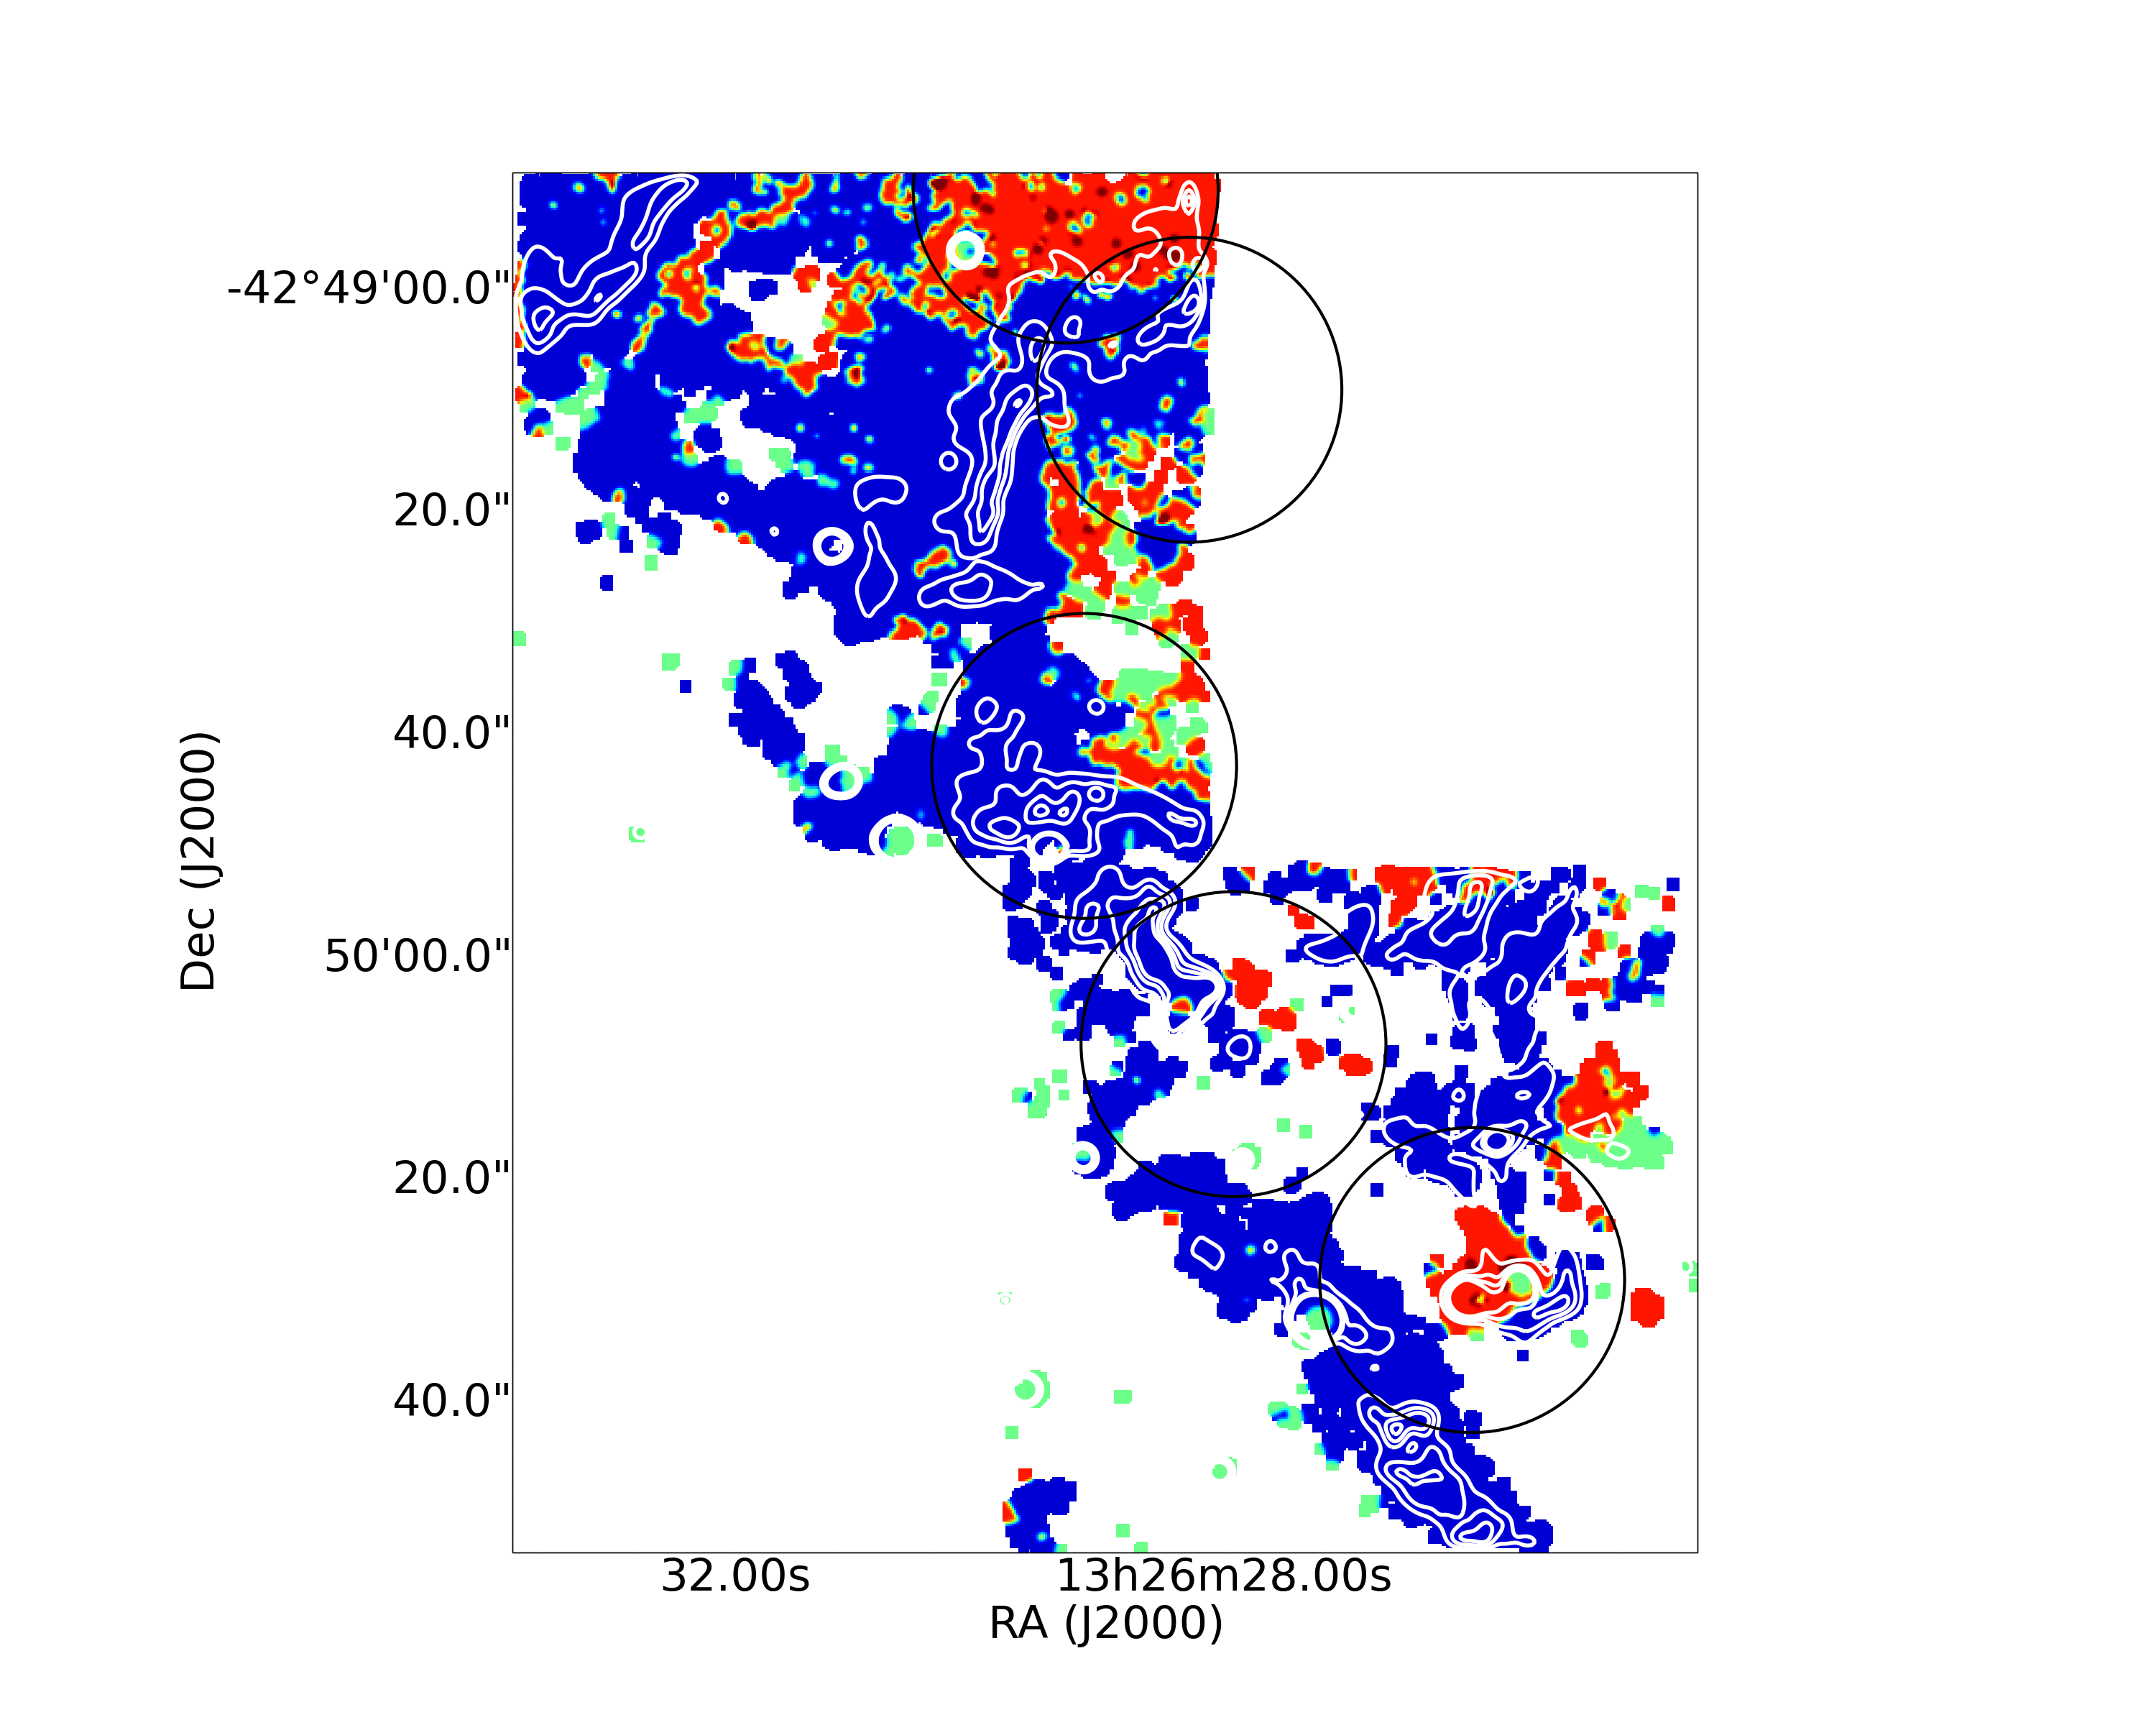
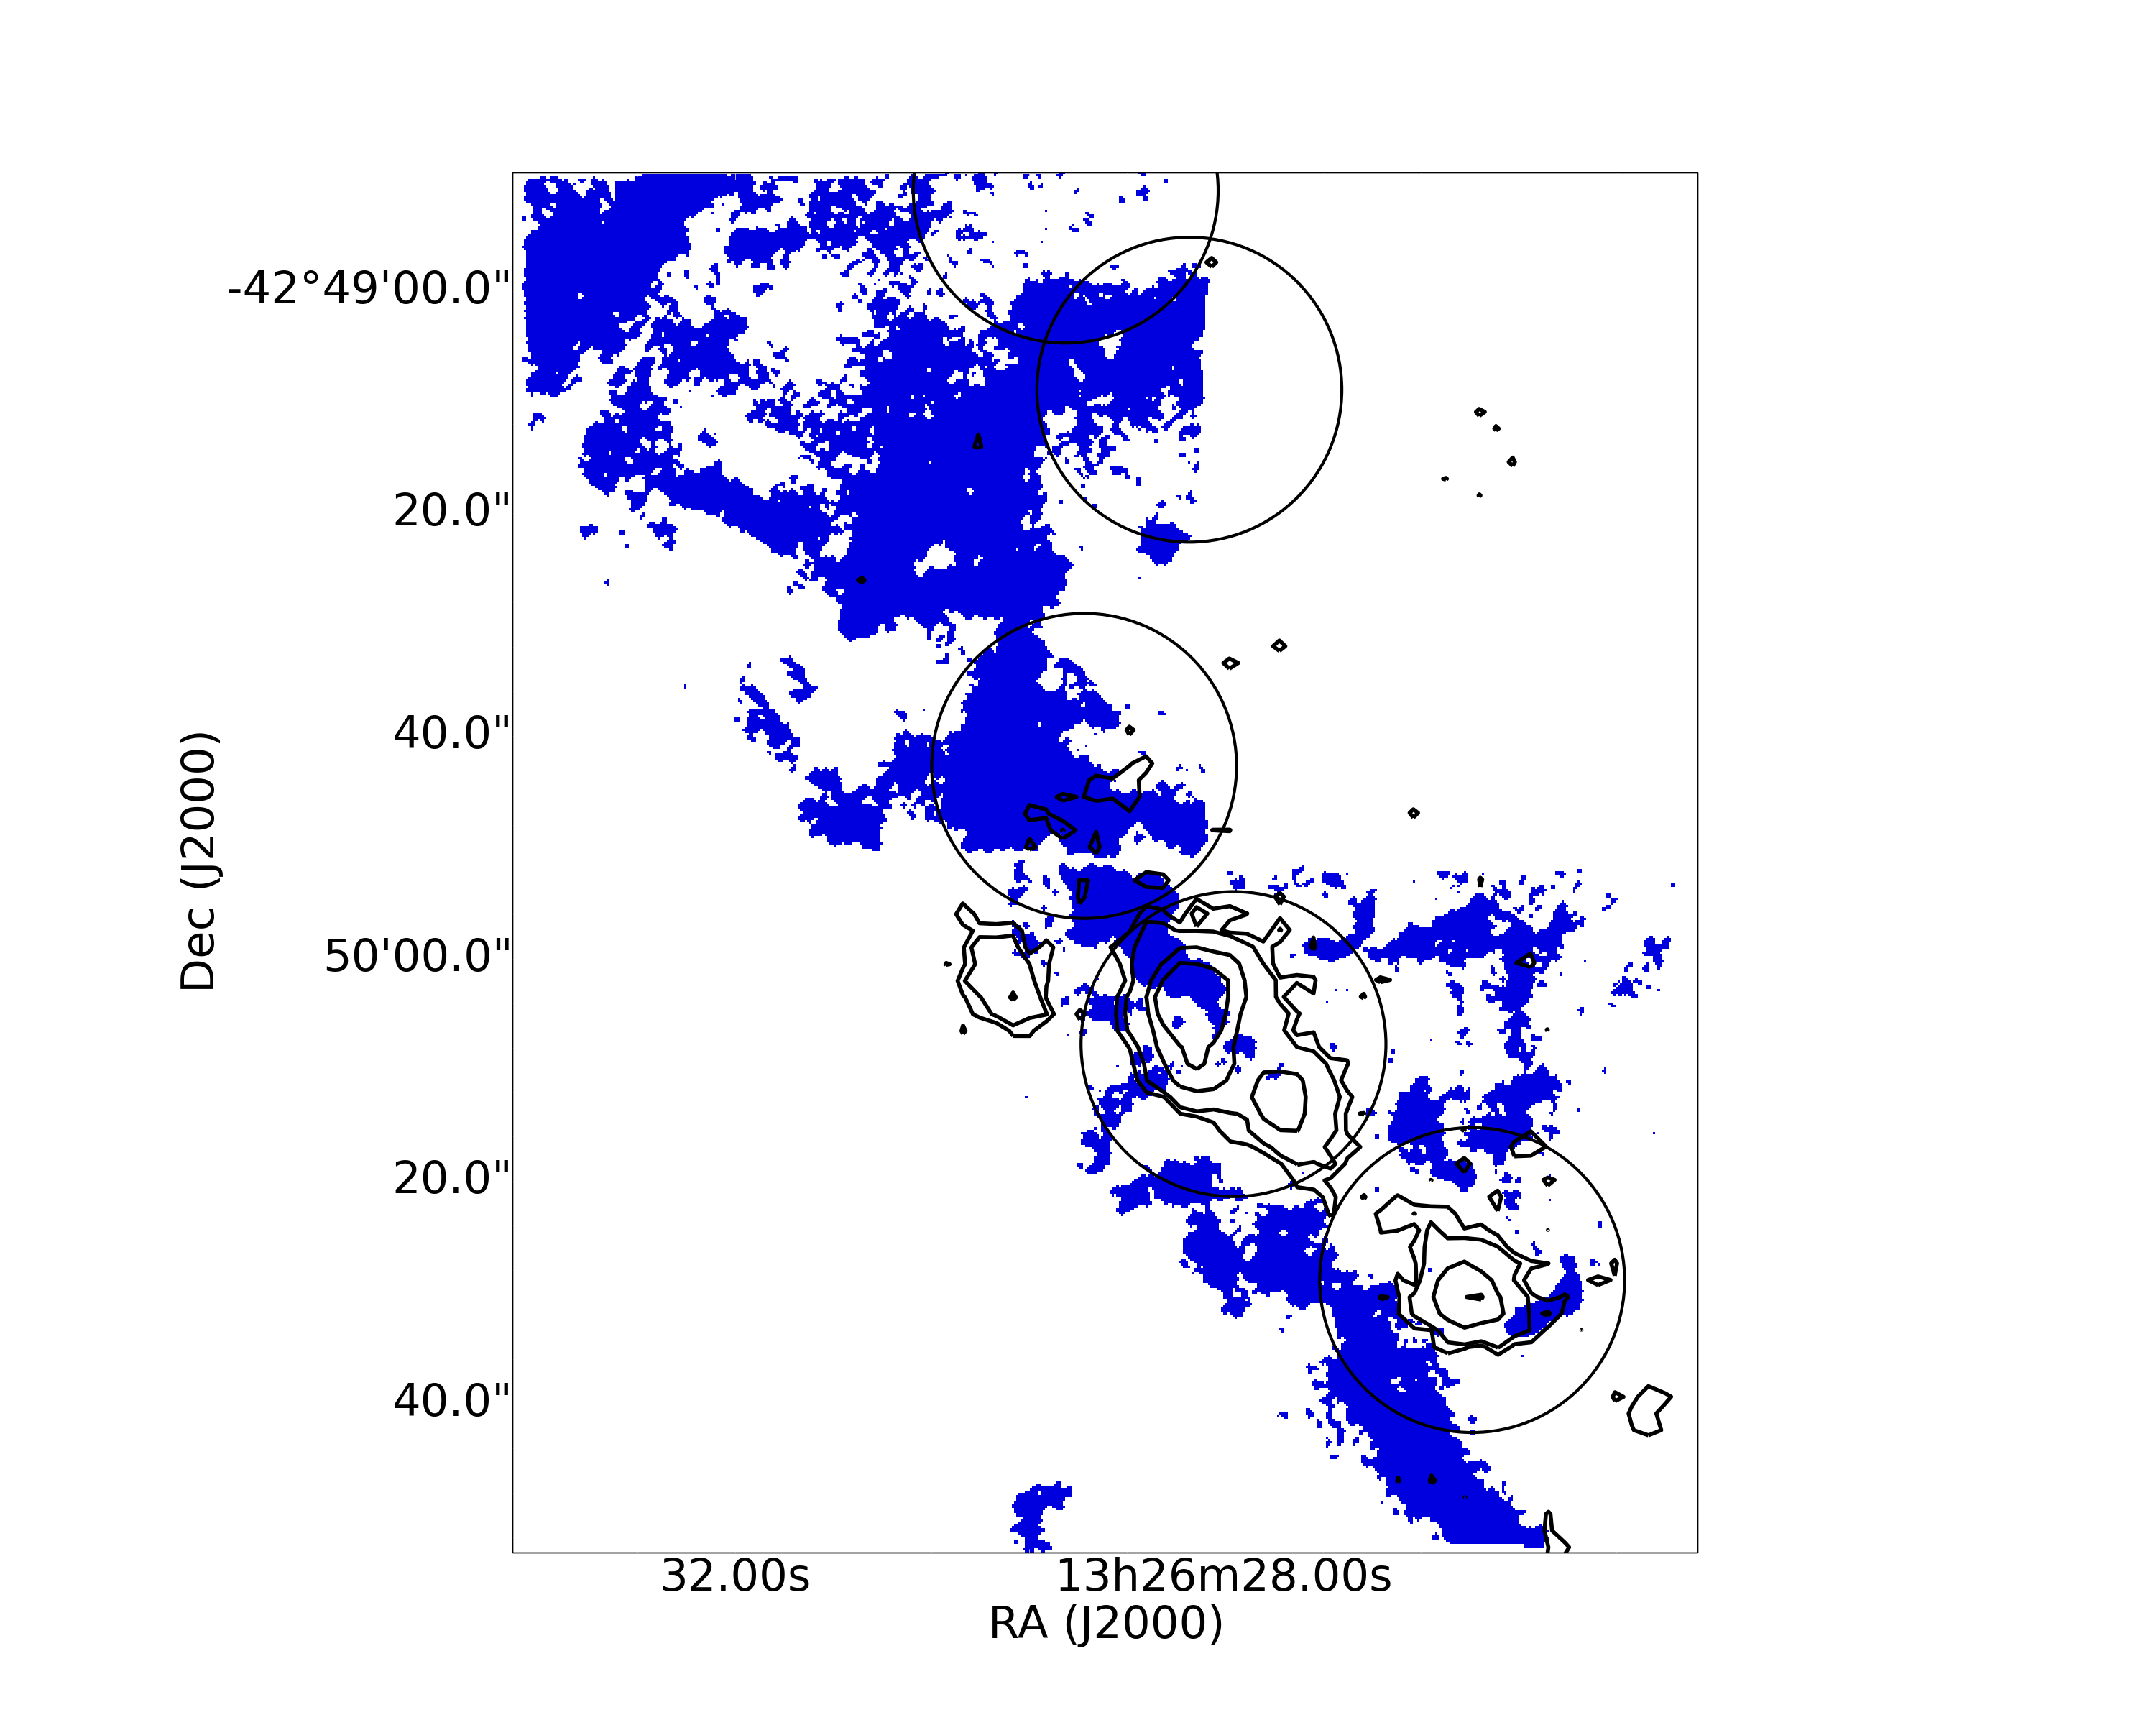
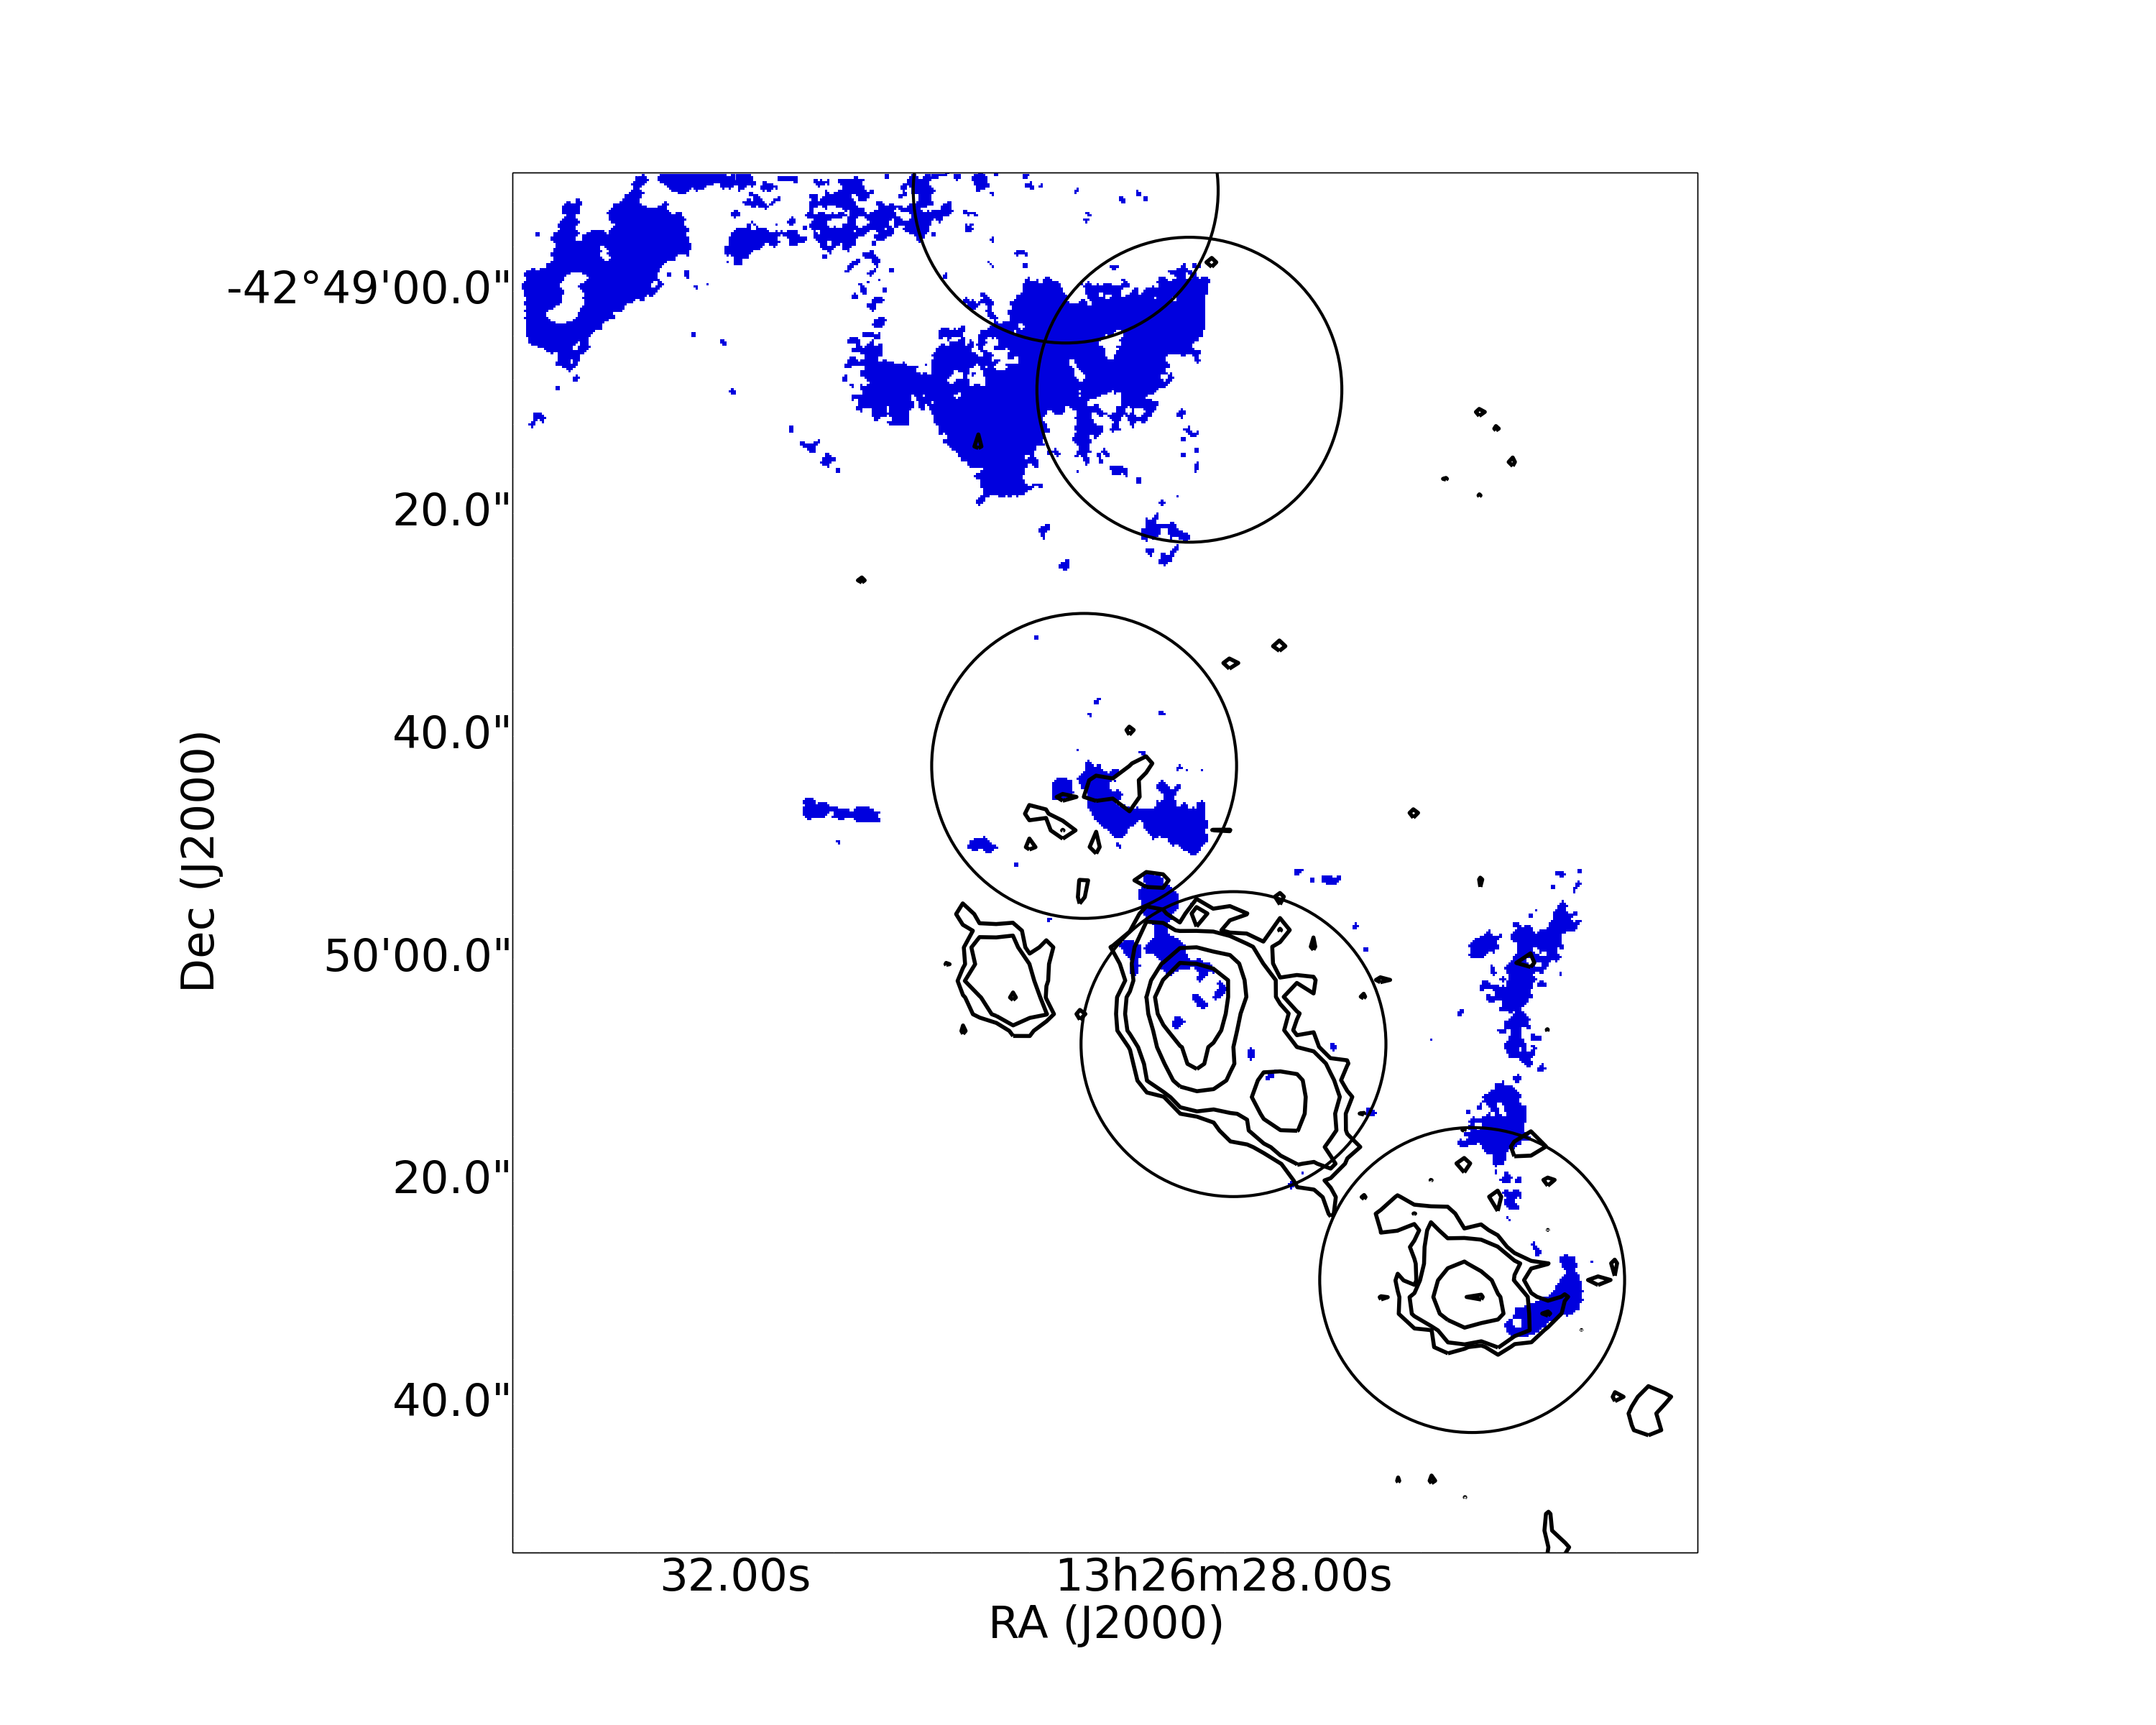
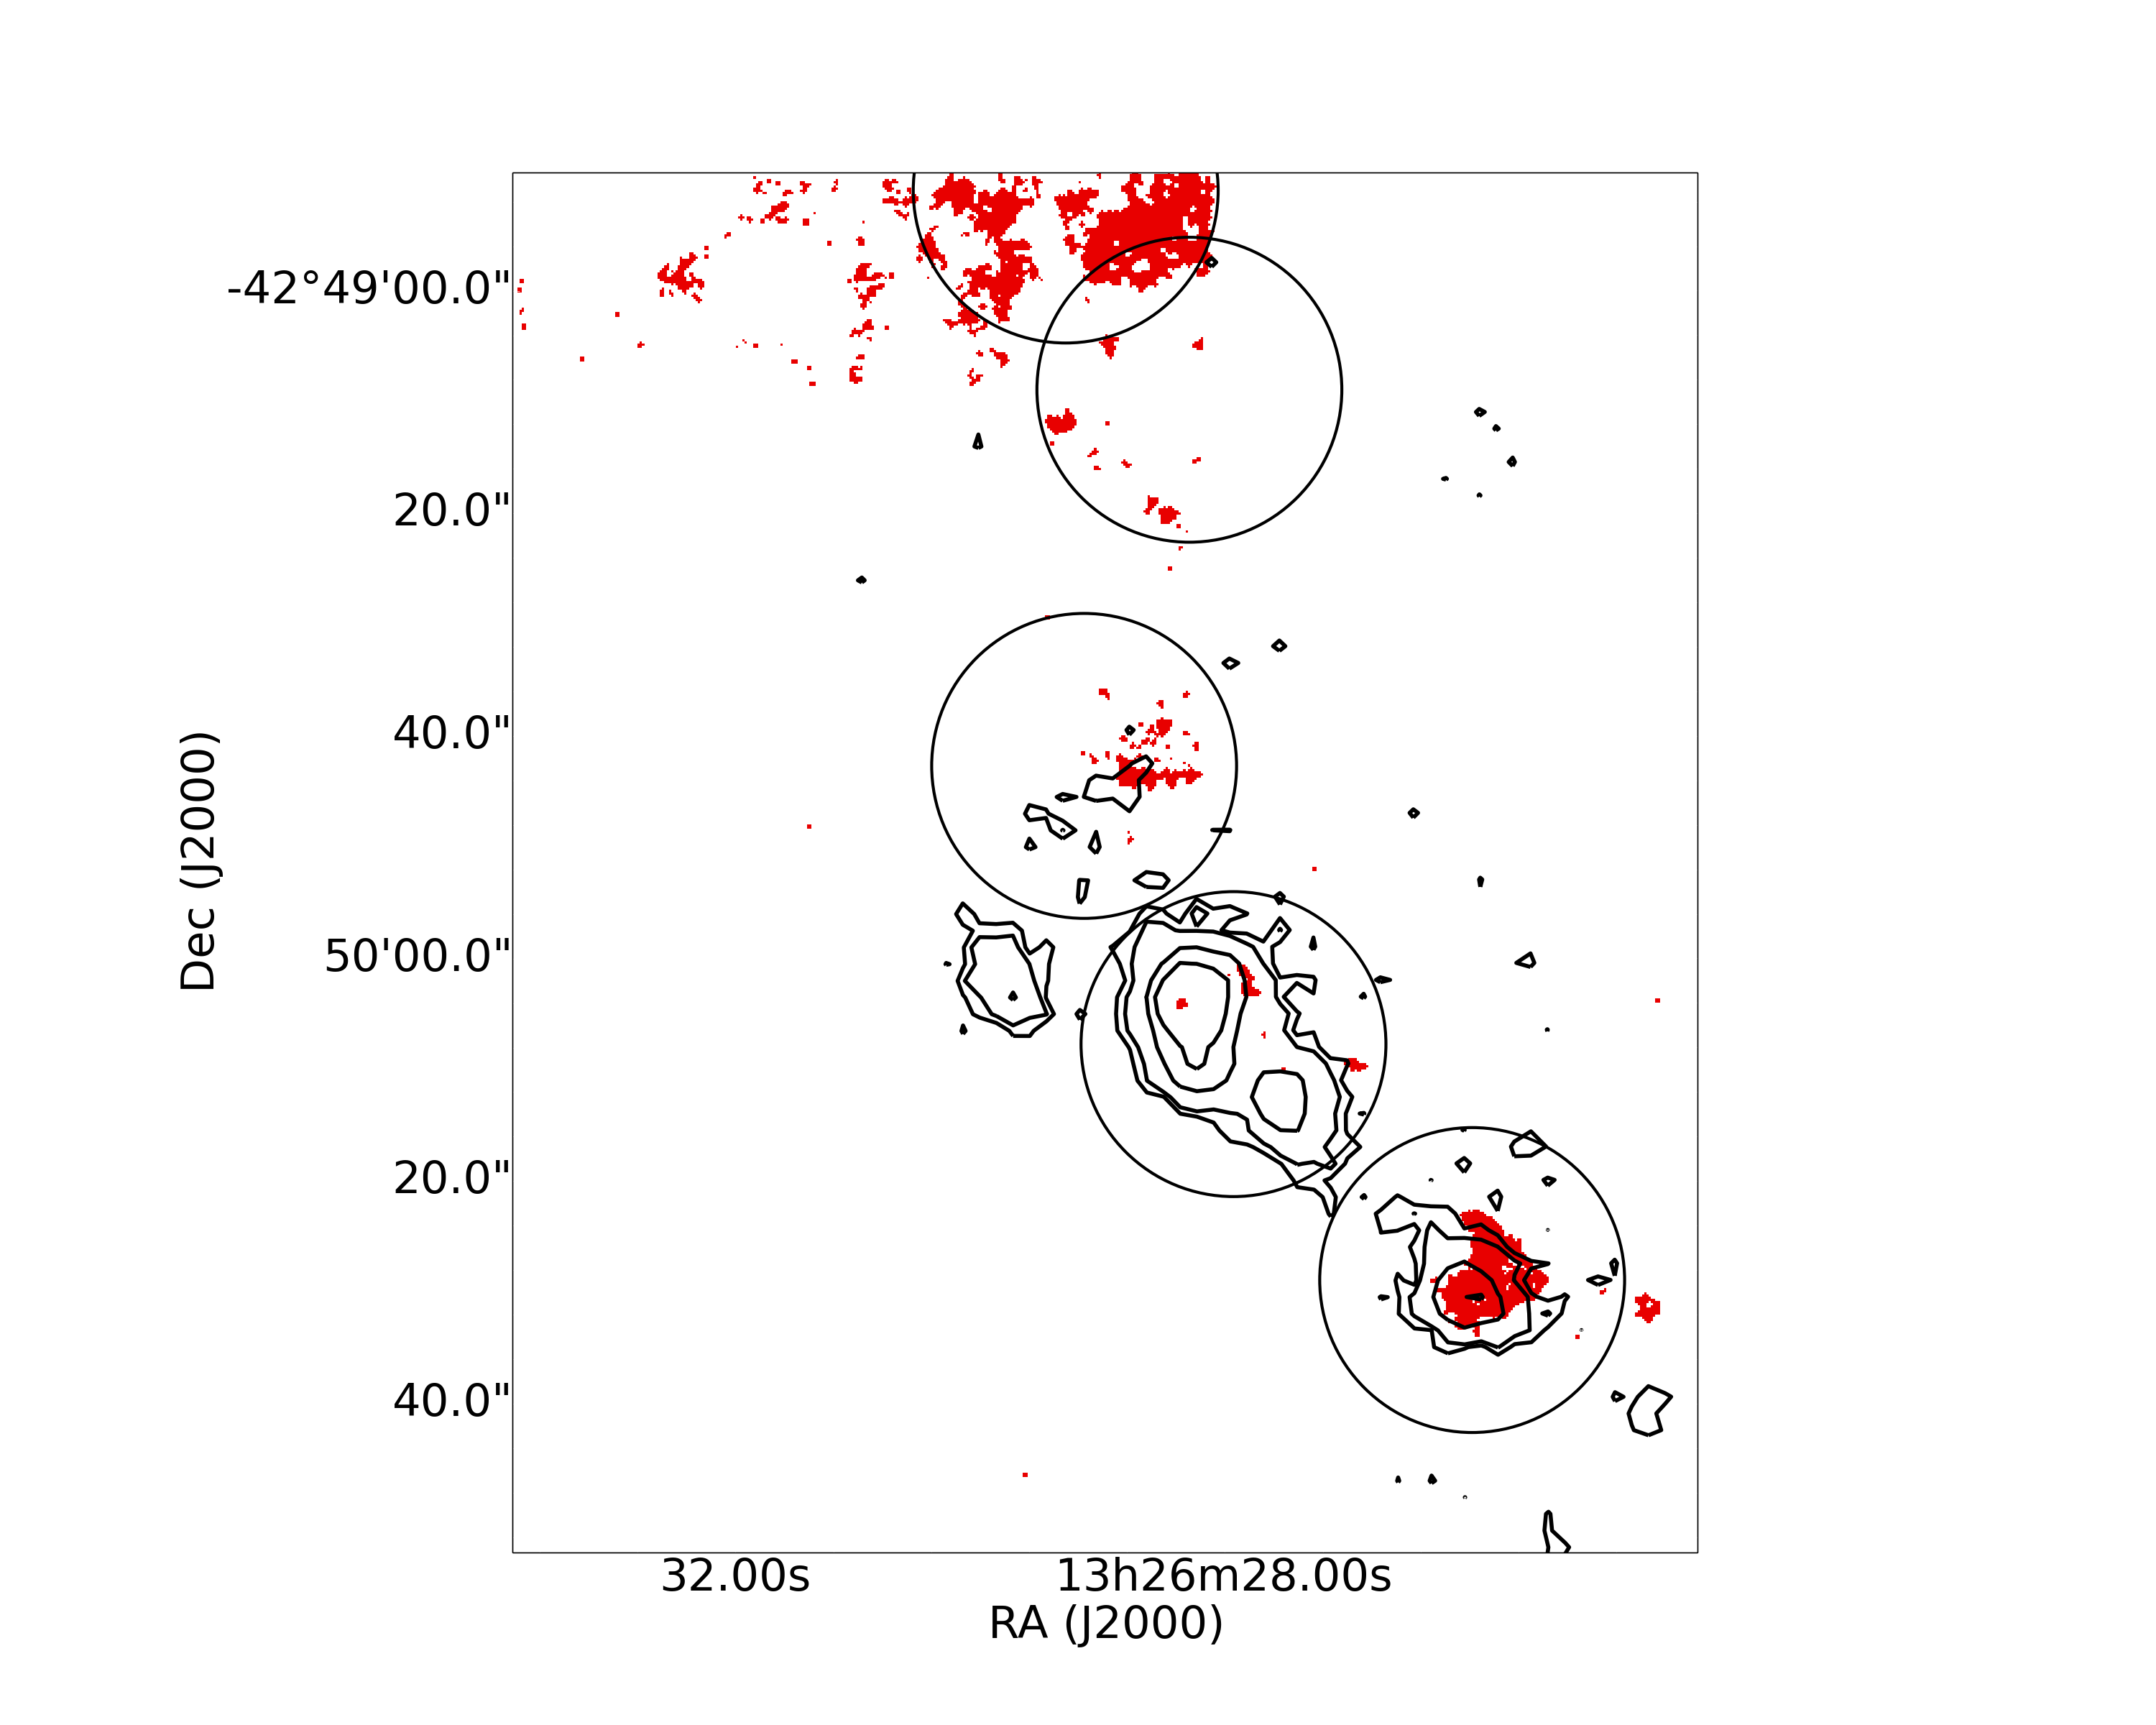
Fig. 10
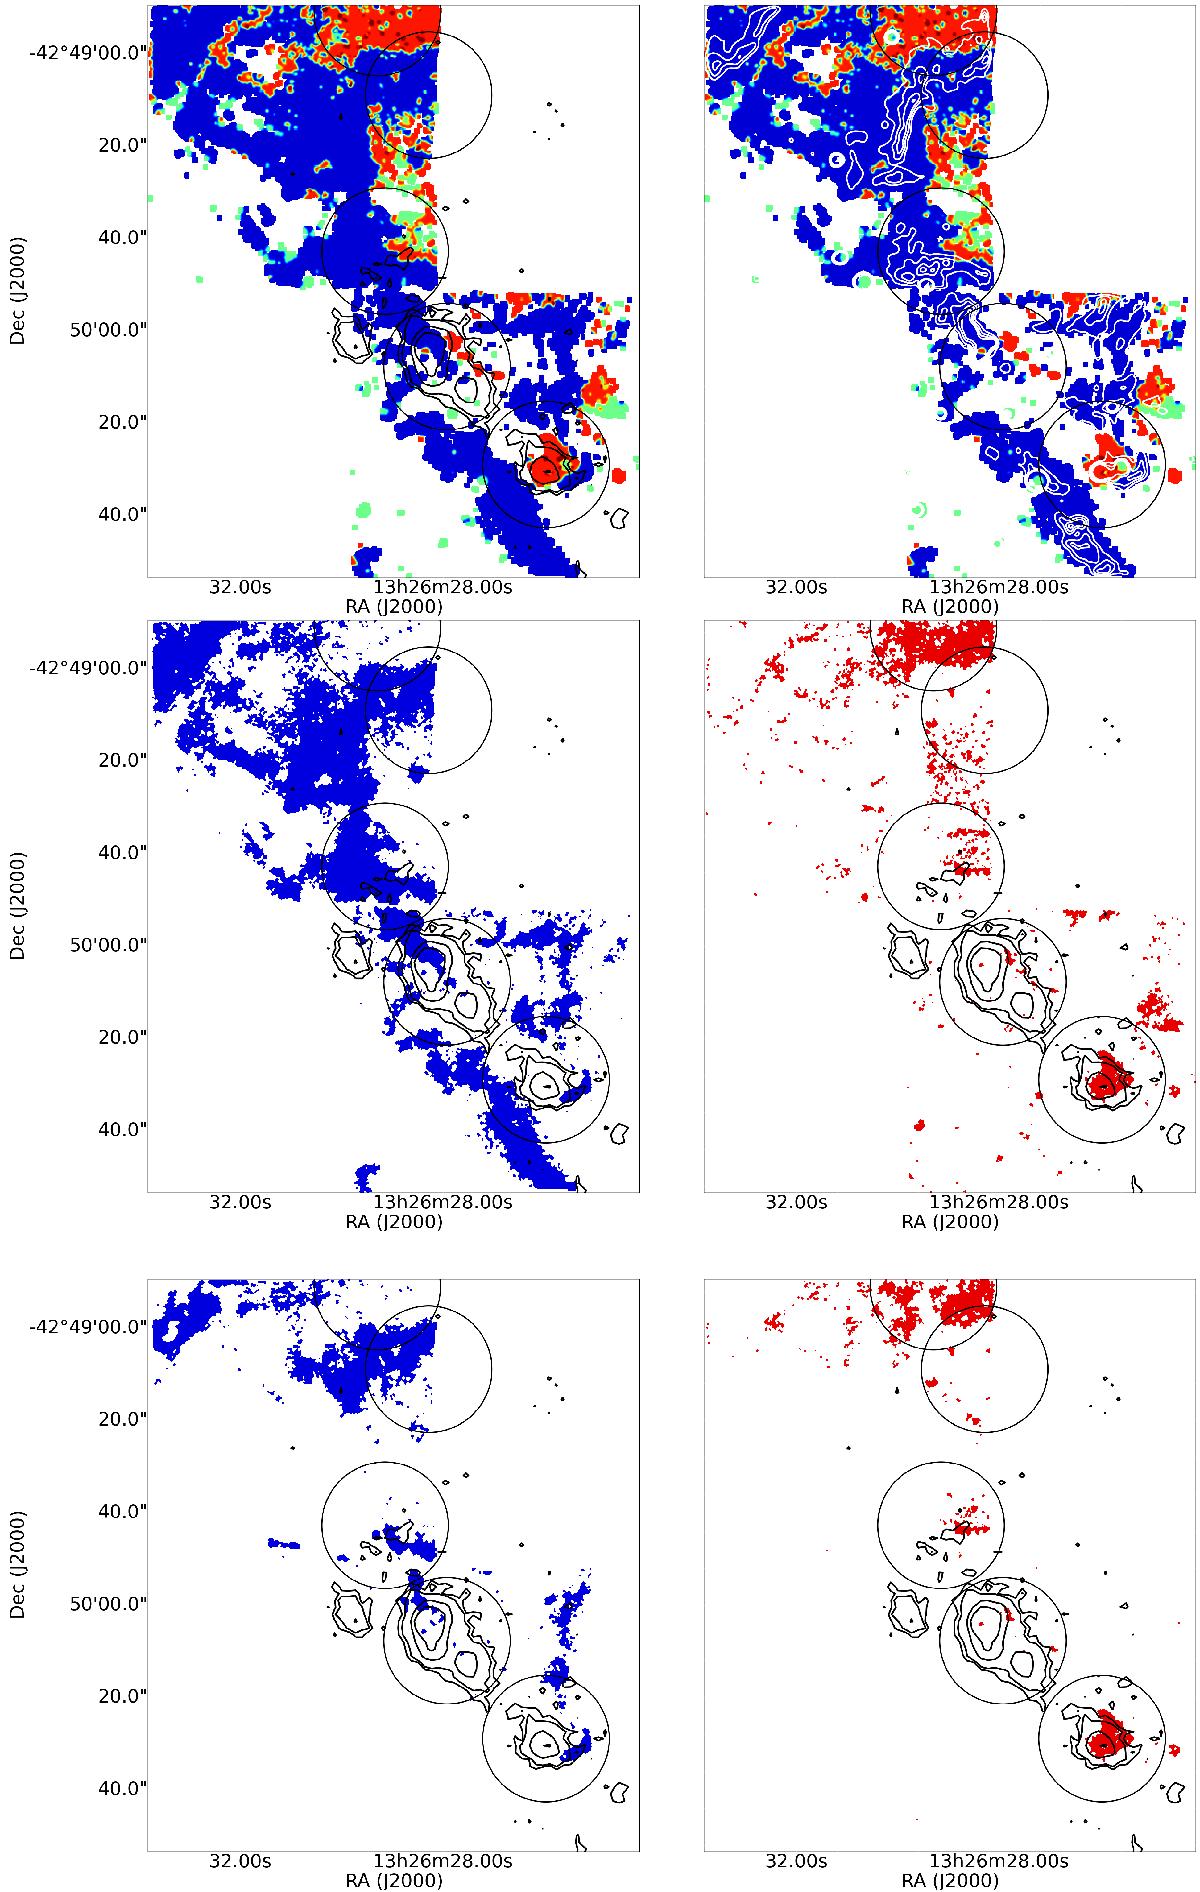
Map of the excitation processes in the field of view of MUSE. Top: RGB map with star formation in green, AGN or shocks in blue, composite in red. The contours show the UV emission from GALEX (black; left) and the Hα-[N ii] emission from MUSE (white; right). Middle: separation of the AGN or shocks excitation (left), and the SF+composite excitation (right). Bottom: separation of the AGN or shocks excitation (left), and the SF+composite excitation (right) for the velocity range of the CO emission (− 256.8 <v< − 194.5 km s-1; relative to Centaurus A). The APEX beams are represented by the circles.
Current usage metrics show cumulative count of Article Views (full-text article views including HTML views, PDF and ePub downloads, according to the available data) and Abstracts Views on Vision4Press platform.
Data correspond to usage on the plateform after 2015. The current usage metrics is available 48-96 hours after online publication and is updated daily on week days.
Initial download of the metrics may take a while.