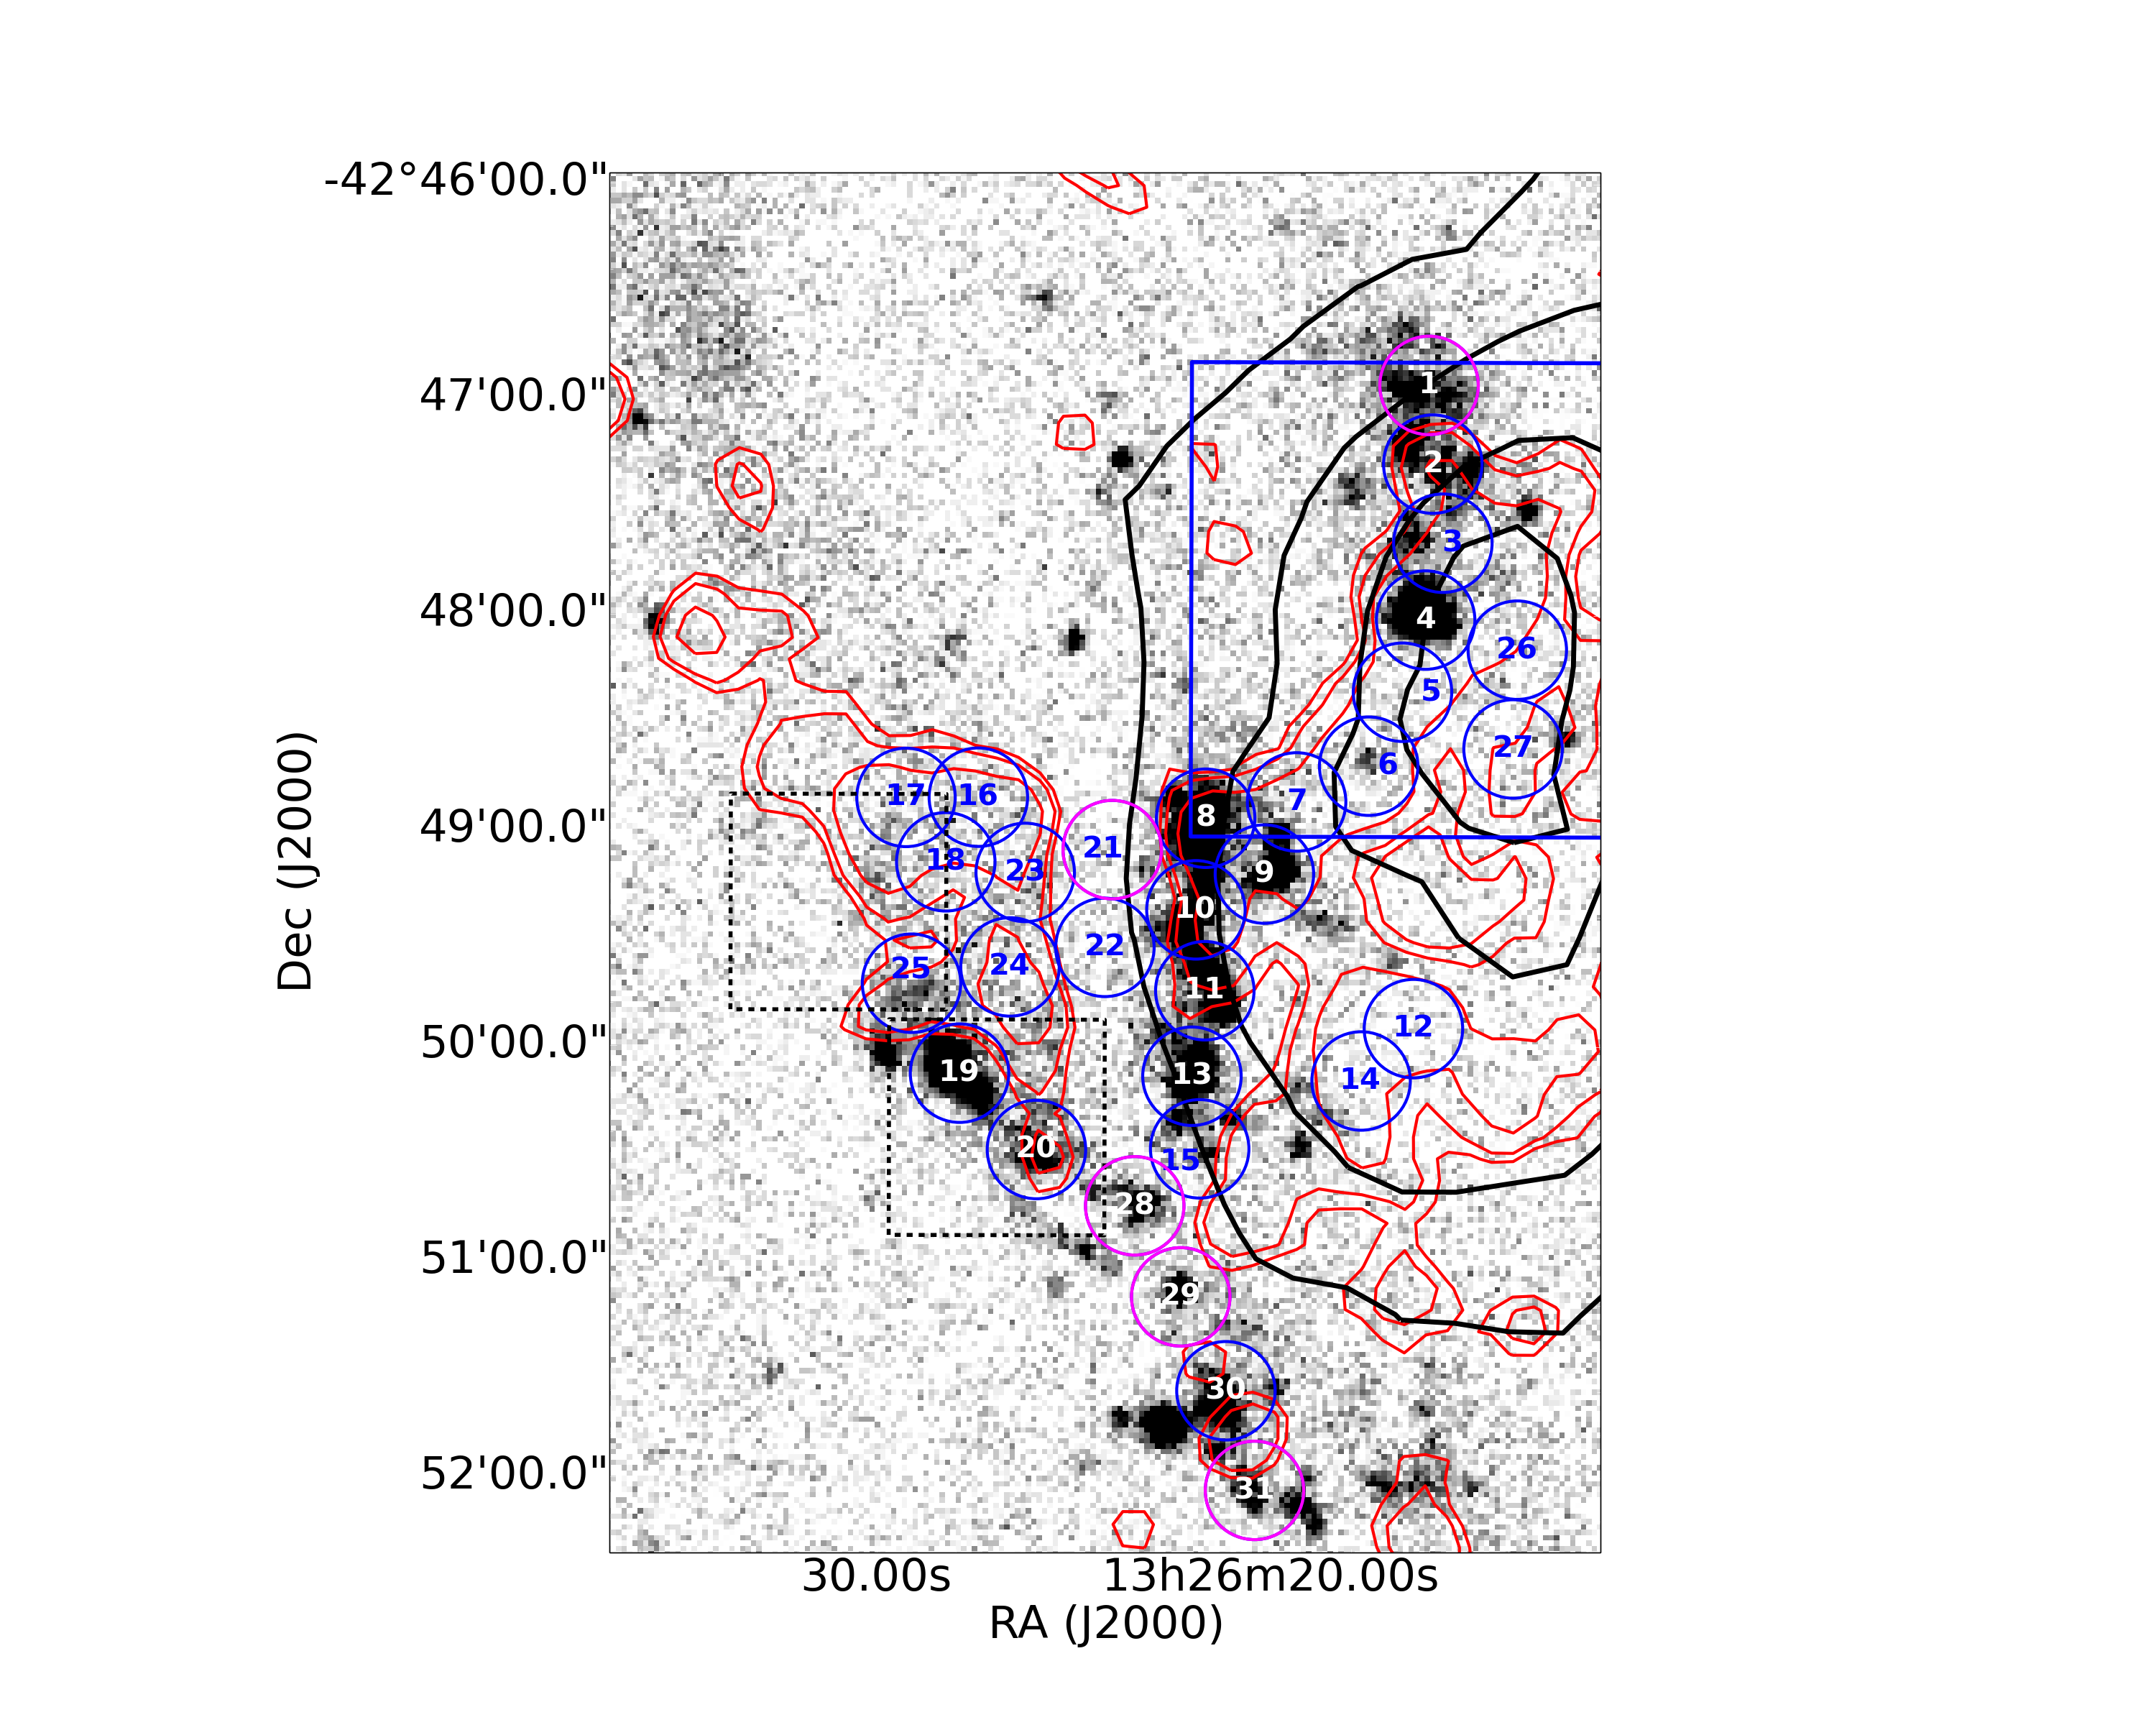
Fig. 1
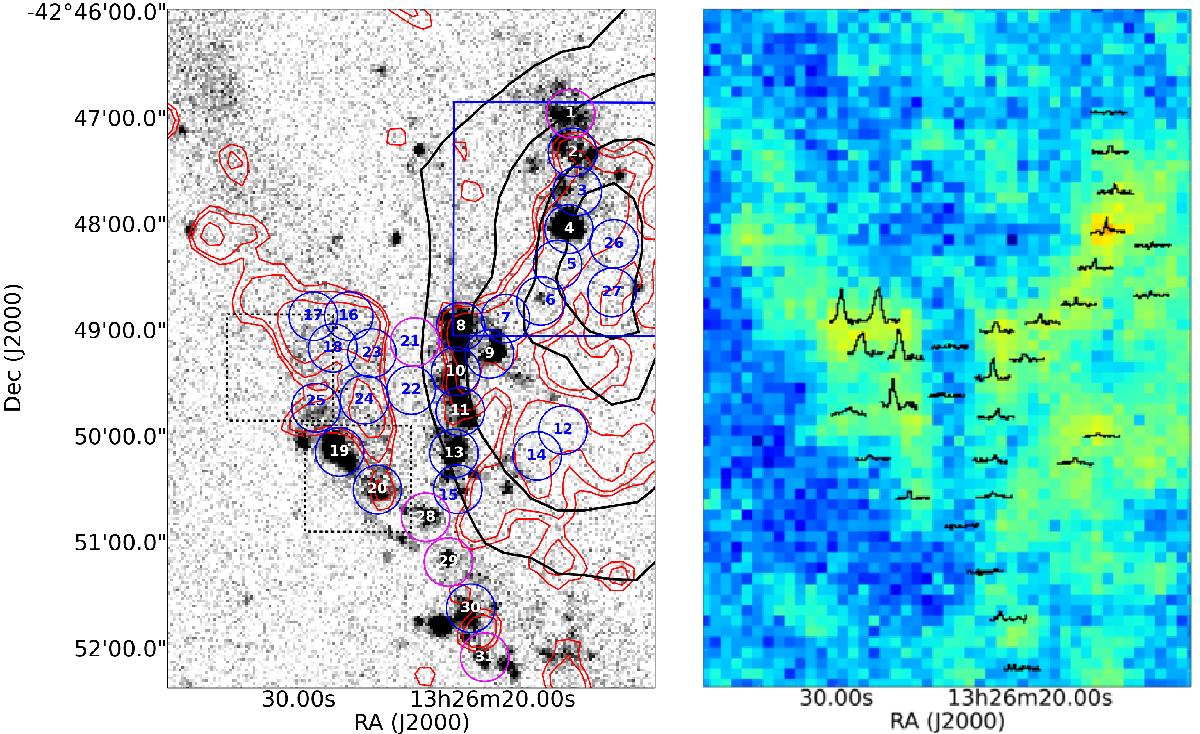
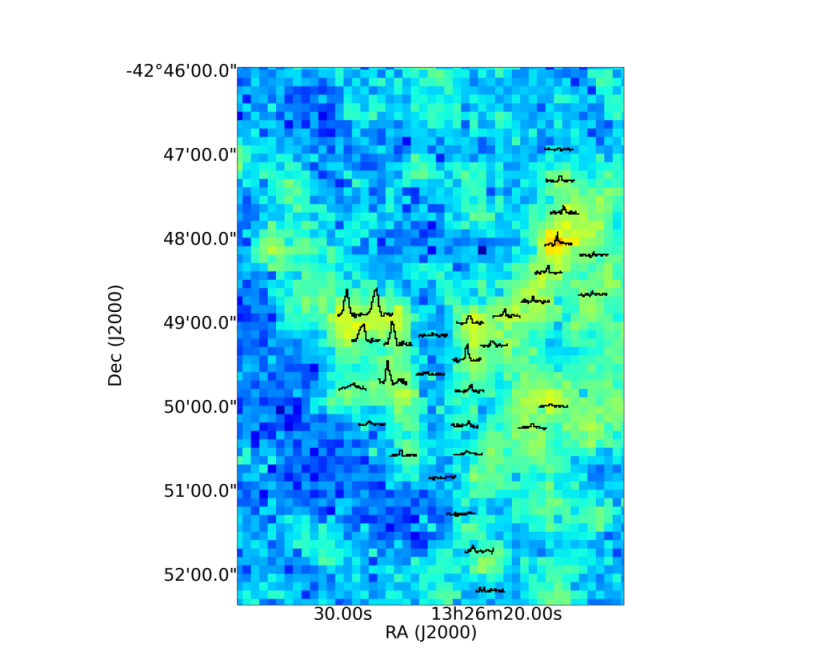
Left: far-UV image of the outer filaments from GALEX (Neff et al. 2015). The black and red contours correspond to the H i and the Herschel-SPIRE 250μm emission (Schiminovich et al. 1994; Auld et al. 2012), respectively. The blue box corresponds the region observed by Charmandaris et al. (2000) with SEST, and the dashed boxes show the field of view of MUSE observations (Santoro et al. 2015b). The circles show the position observed with APEX (CO(2−1) beam). The magenta circles show the non-detections. The regions of Table A.2 are labelled with their number. Right: map of the Herschel-SPIRE 250μm emission. The APEX spectra are overlaid in black.
Current usage metrics show cumulative count of Article Views (full-text article views including HTML views, PDF and ePub downloads, according to the available data) and Abstracts Views on Vision4Press platform.
Data correspond to usage on the plateform after 2015. The current usage metrics is available 48-96 hours after online publication and is updated daily on week days.
Initial download of the metrics may take a while.