Fig. 3
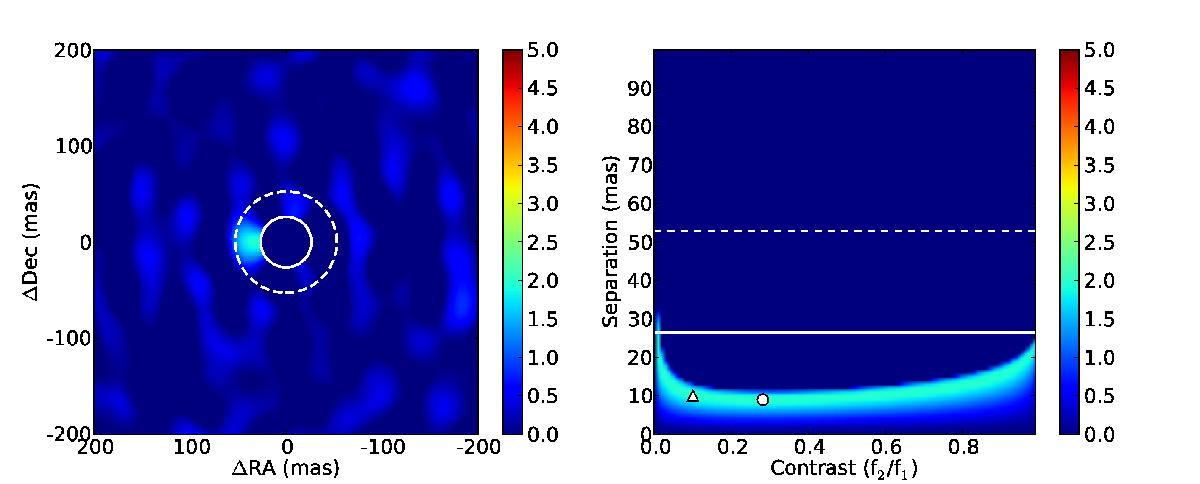
Left: significance map. Right: degeneracy plot. Simulated data of a a companion located at a separation of 10 mas, a position angle of 90°, and contributed 10% of the total flux (white triangle). The white circle shows our best fit position. Within the background it is possible to see noise artefacts caused by holes within the uv-coverage. These holes create periodic signals within the background and may take on geometric patterns.
Current usage metrics show cumulative count of Article Views (full-text article views including HTML views, PDF and ePub downloads, according to the available data) and Abstracts Views on Vision4Press platform.
Data correspond to usage on the plateform after 2015. The current usage metrics is available 48-96 hours after online publication and is updated daily on week days.
Initial download of the metrics may take a while.