Fig. 2
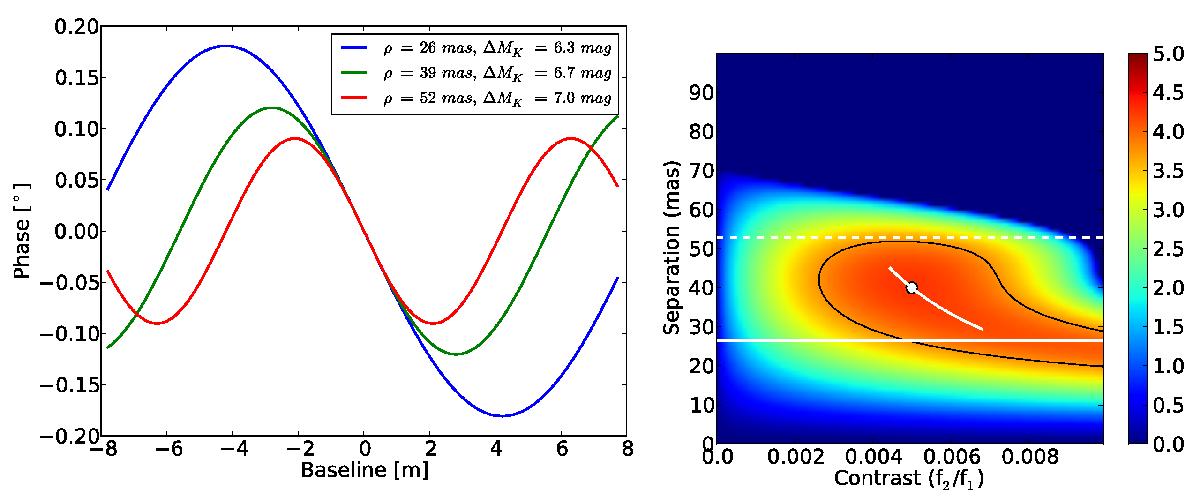
Degeneracy plots of the detection in DM Tau. Left: phases for three companions at three separations and their contrasts according to Eq. (5). Right: fit of the degeneracy profile using the shortest projected baseline length. The fit using the longer baseline well describes the profile at larger separations but poorly describes the shorter separations as the contrast ratio asymptotically goes to 1.0 as the separation approaches λ/2D. The shortest baseline poorly follows the structure at larger separations but does follow closely the profile at closer separations as a result of its ability to probe the more S/N sensitive region close to the λ/2D resolution limit.
Current usage metrics show cumulative count of Article Views (full-text article views including HTML views, PDF and ePub downloads, according to the available data) and Abstracts Views on Vision4Press platform.
Data correspond to usage on the plateform after 2015. The current usage metrics is available 48-96 hours after online publication and is updated daily on week days.
Initial download of the metrics may take a while.