Fig. 11
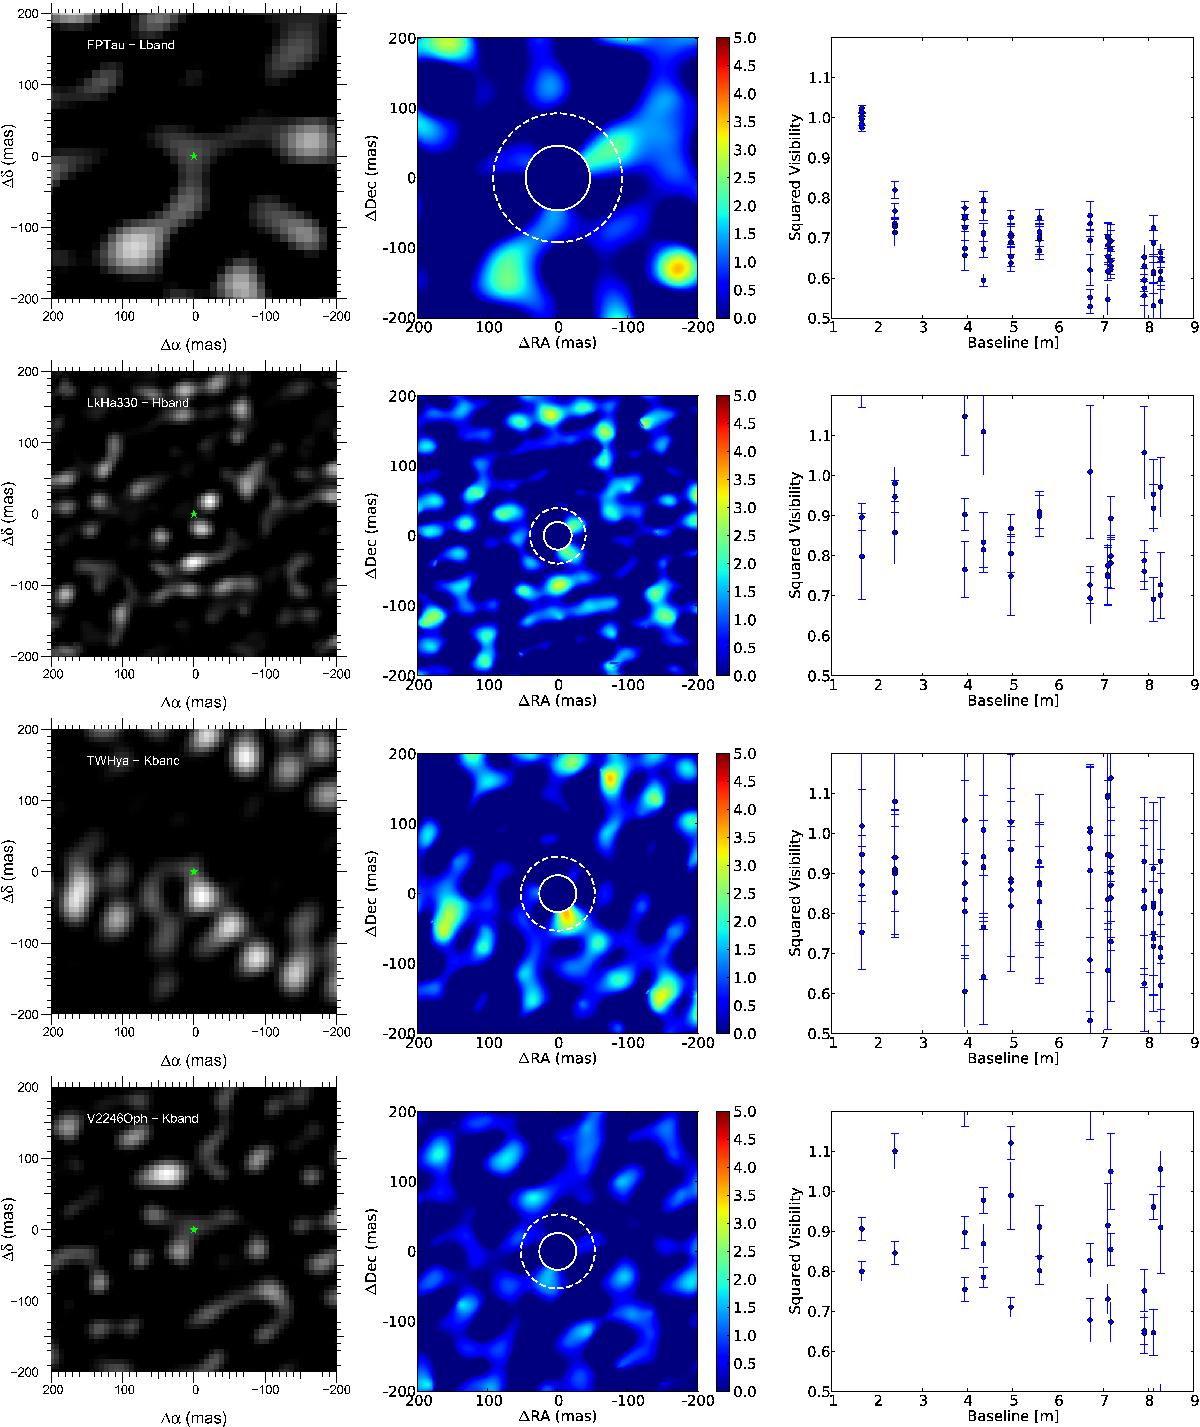
Data sets where we see no significant emission. Left: reconstructed Images. Middle: computed significance maps. Right: V2 plot. First row: FP Tau, L-band. Second row: LkHα330, H-band. Third row: TW Hya, K′-band. Fourth row:, V2246 Oph, K′-band. In these cases we set limits on the contrast of a potential candidate or disc feature.
Current usage metrics show cumulative count of Article Views (full-text article views including HTML views, PDF and ePub downloads, according to the available data) and Abstracts Views on Vision4Press platform.
Data correspond to usage on the plateform after 2015. The current usage metrics is available 48-96 hours after online publication and is updated daily on week days.
Initial download of the metrics may take a while.