Fig. 7
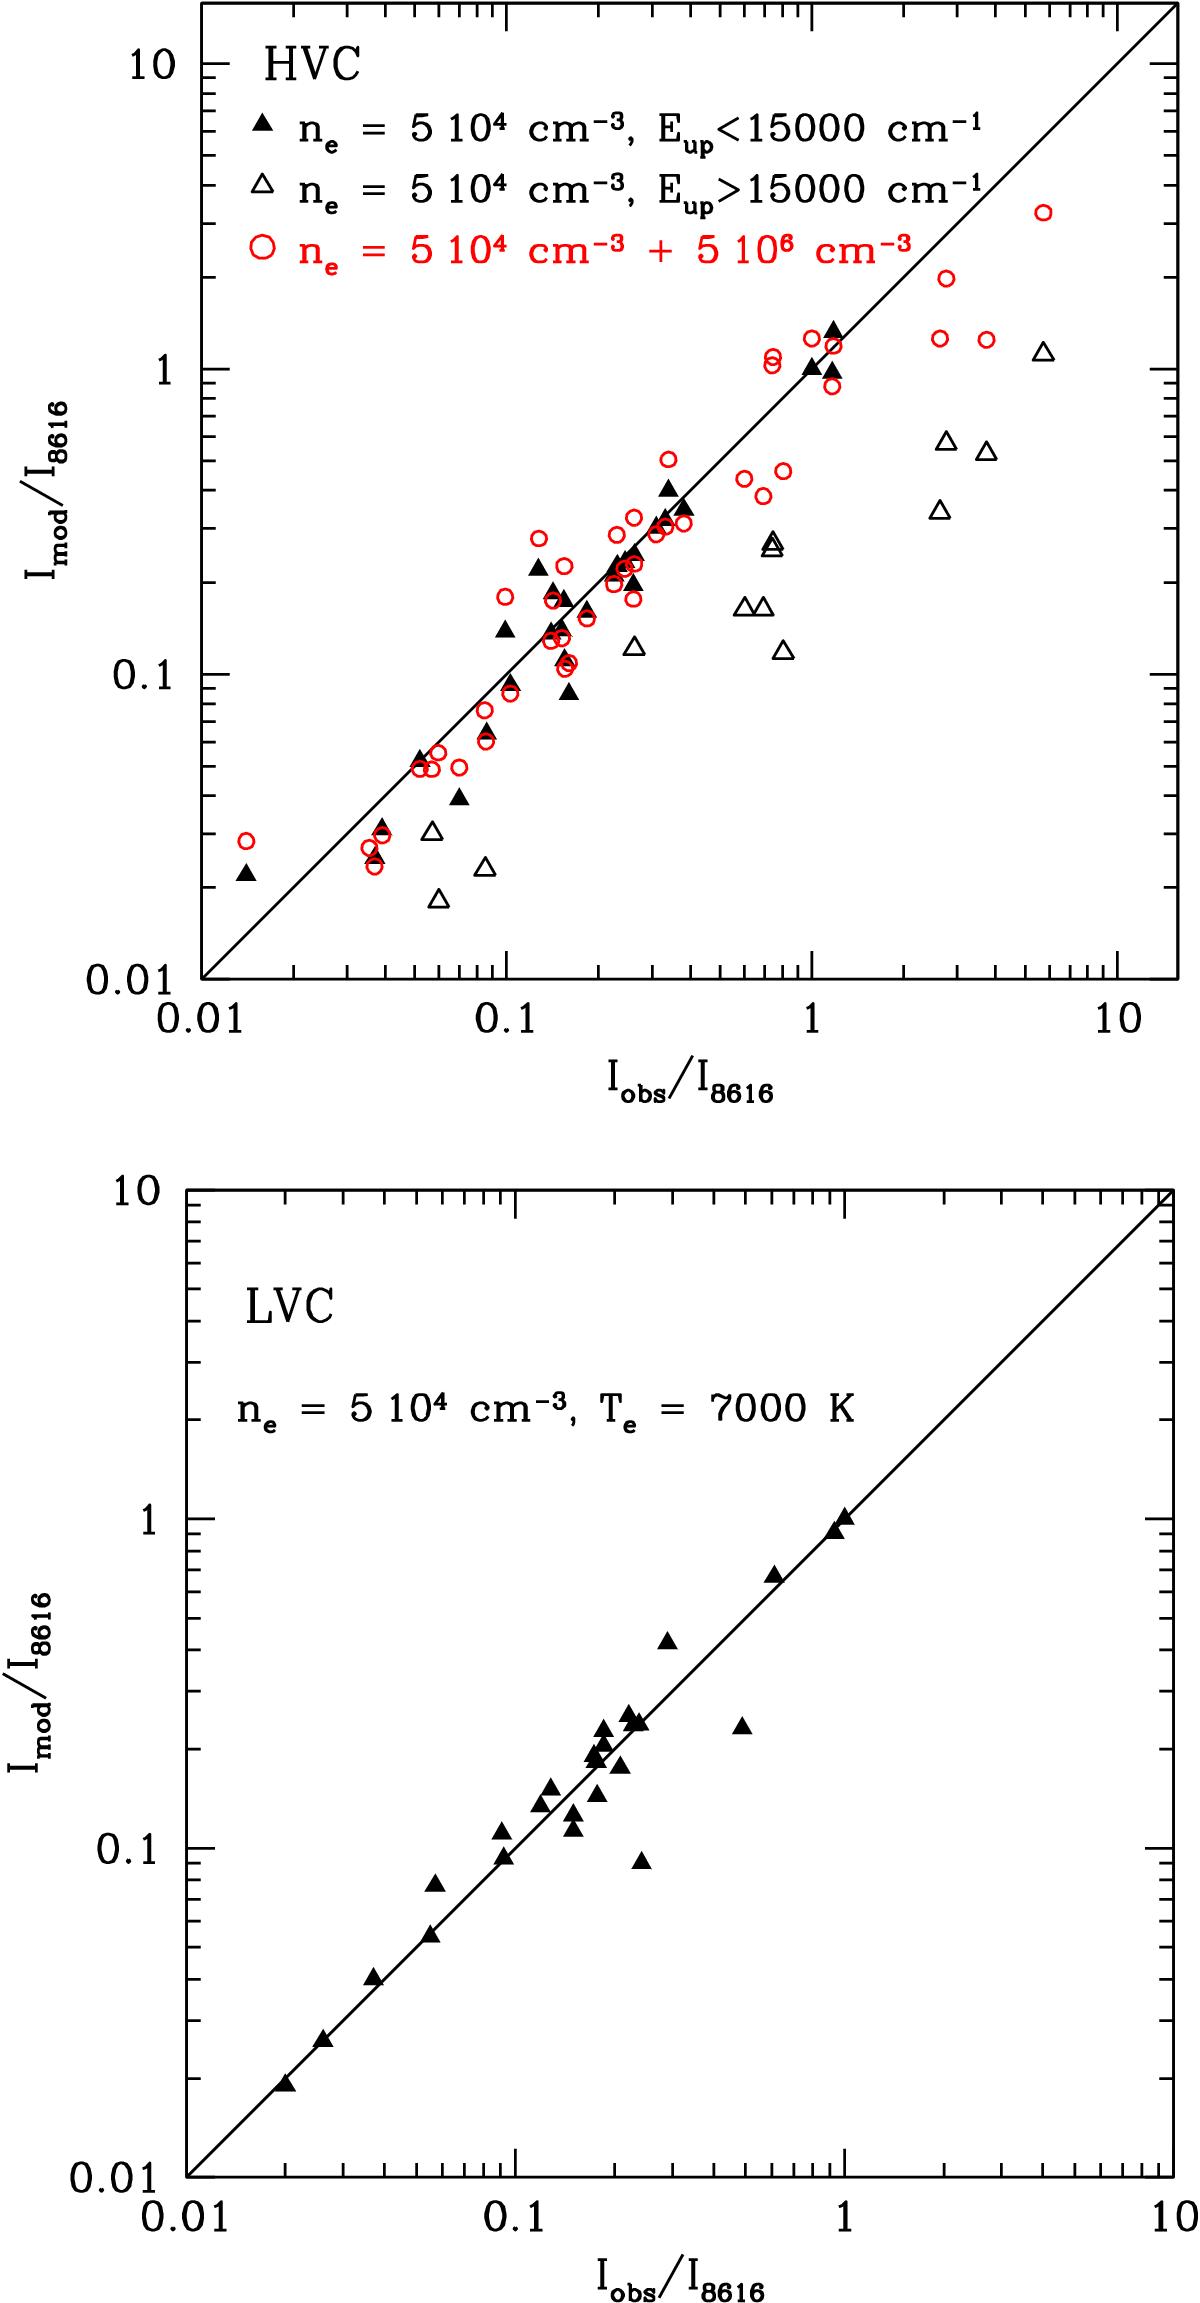
[Fe II] observed vs. model predicted line intensities, normalized to the 8616 Å transition, relative to the HVC (top panel) and LVC (bottom panel). For the HVC, triangles refer to the model with a single gas component at ne = 5 × 104 cm-3 and Te > 15 000 K: filled (open) symbols indicate transitions with upper energies below (above) 15 000 cm-1. Red open circles refer to the model that includes an additional high density component with ne > 5 × 106 cm-3 to better fit the transitions at higher excitation energies.
Current usage metrics show cumulative count of Article Views (full-text article views including HTML views, PDF and ePub downloads, according to the available data) and Abstracts Views on Vision4Press platform.
Data correspond to usage on the plateform after 2015. The current usage metrics is available 48-96 hours after online publication and is updated daily on week days.
Initial download of the metrics may take a while.