Fig. 3
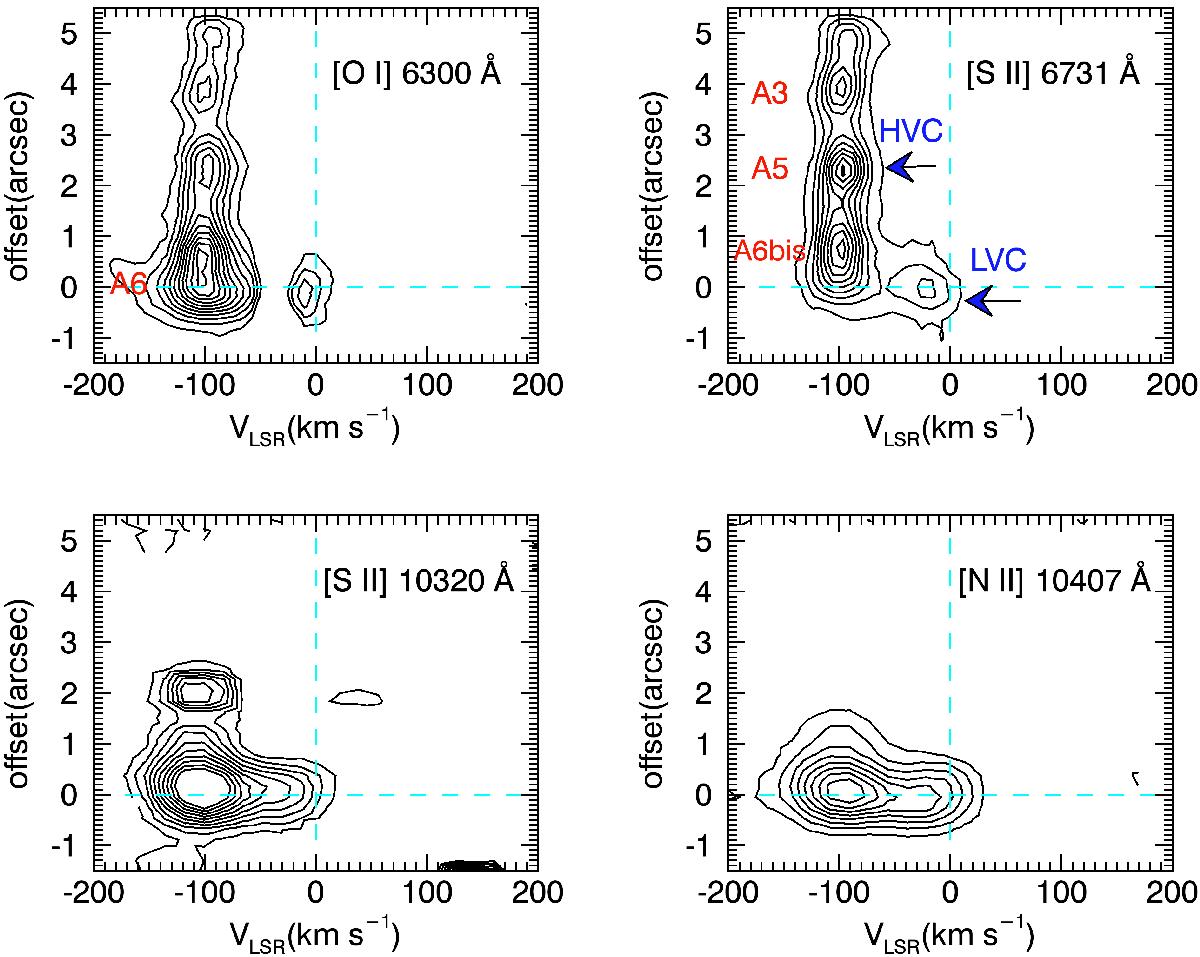
Continuum-subtracted position velocity (PV) maps of [O i], [S ii], and [N ii] lines observed in the X-shooter spectrum. The PV are oriented along the jet, with a PA = 162°. Contours start at 3σ and are drawn at steps of 3σ with the exception of [S ii] 6731 Å where the contours are drawn in steps of 6σ. Radial velocities have been corrected for the source systemic velocity of +8 km s-1. The main peaks are labeled following the nomenclature of Fig. 1. The HVC and LVC are also indicated.
Current usage metrics show cumulative count of Article Views (full-text article views including HTML views, PDF and ePub downloads, according to the available data) and Abstracts Views on Vision4Press platform.
Data correspond to usage on the plateform after 2015. The current usage metrics is available 48-96 hours after online publication and is updated daily on week days.
Initial download of the metrics may take a while.