Fig. 10
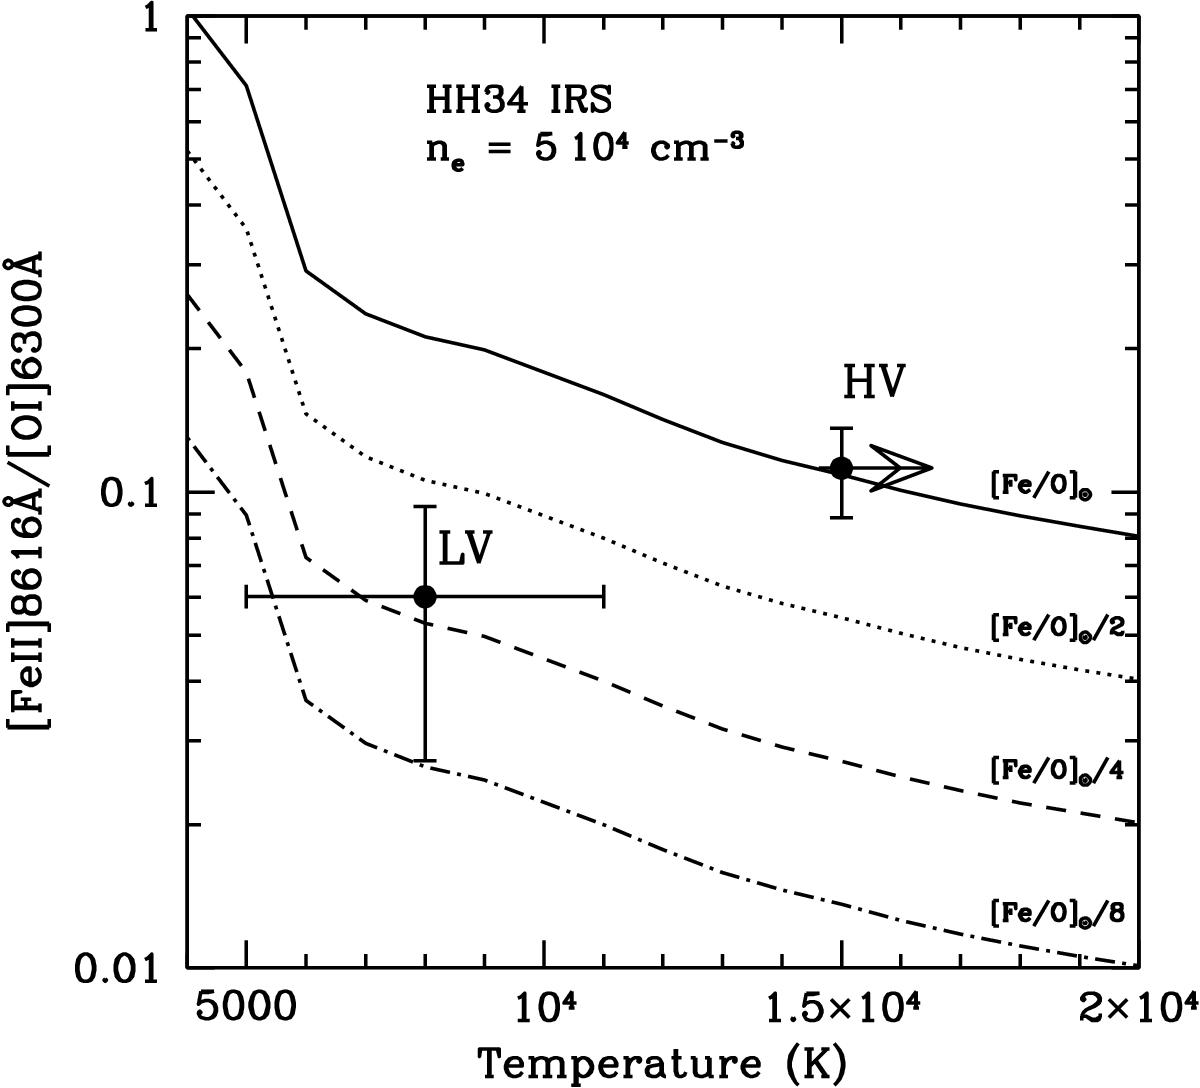
[Fe ii] 8616 Å/[O i] 6300 Å ratio plotted against the gas temperature for a density of 5 × 104 cm-3. The solid curve shows predictions assuming an [Fe/O] solar gas phase abundance of 0.062 (Asplund et al. 2006). Other curves are plotted for decreasing values of the [Fe/O] abundance. Data points correspond to the values measured in the HVC and LVC toward HH34 IRS, and indicate an [Fe/O] abundance ratio close to solar for the HVC and a factor between 2 and 8 below solar for the LVC.
Current usage metrics show cumulative count of Article Views (full-text article views including HTML views, PDF and ePub downloads, according to the available data) and Abstracts Views on Vision4Press platform.
Data correspond to usage on the plateform after 2015. The current usage metrics is available 48-96 hours after online publication and is updated daily on week days.
Initial download of the metrics may take a while.