Fig. F.2
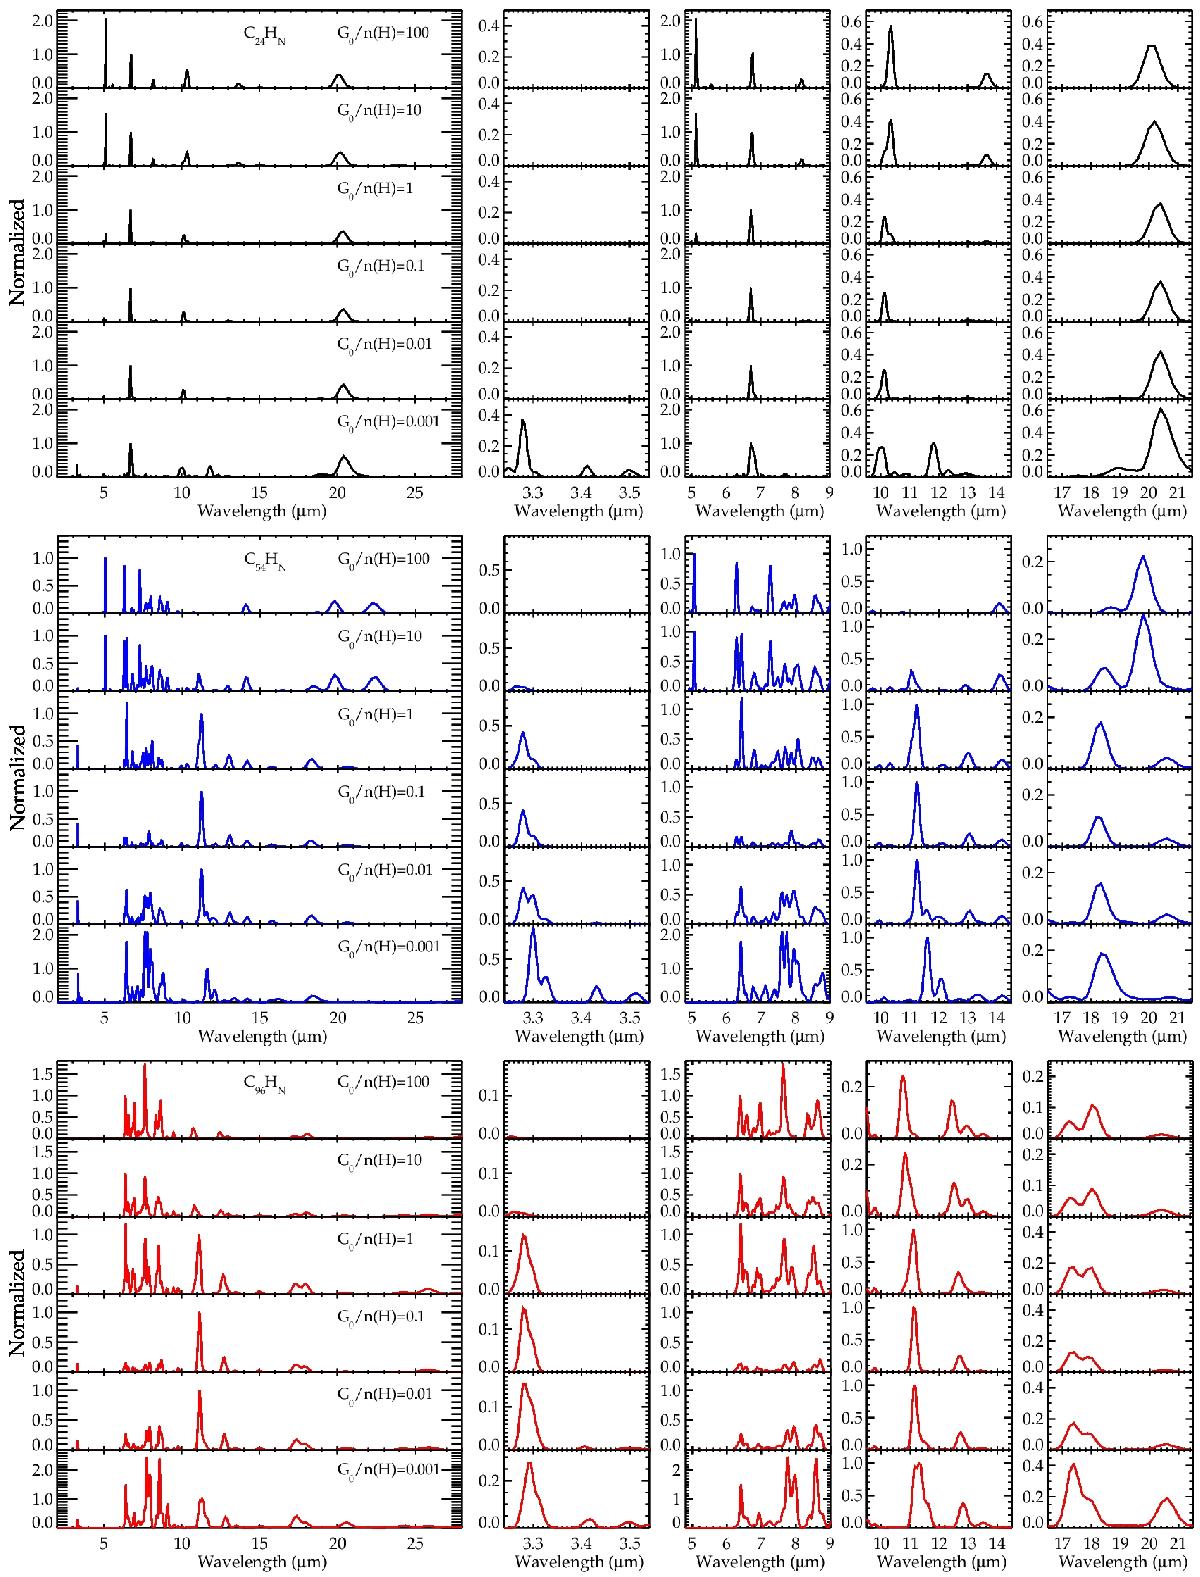
Emission spectra for different G0/n(H) ratios at G0= 103. The results for coronene derivatives are shown in black, while the spectra for C54H18 and C96H24 derivatives are shown in blue and red, respectively. The spectra have been conveniently normalized for a better comparison between consecutive G0/n(H) ratios. Given the unavailability of the intrinsic spectra for some of these molecules, the spectra at low G0/n(H) ratios are not complete due to the increasing abundance of highly superhydrogenated anionic species.
Current usage metrics show cumulative count of Article Views (full-text article views including HTML views, PDF and ePub downloads, according to the available data) and Abstracts Views on Vision4Press platform.
Data correspond to usage on the plateform after 2015. The current usage metrics is available 48-96 hours after online publication and is updated daily on week days.
Initial download of the metrics may take a while.