Fig. F.1
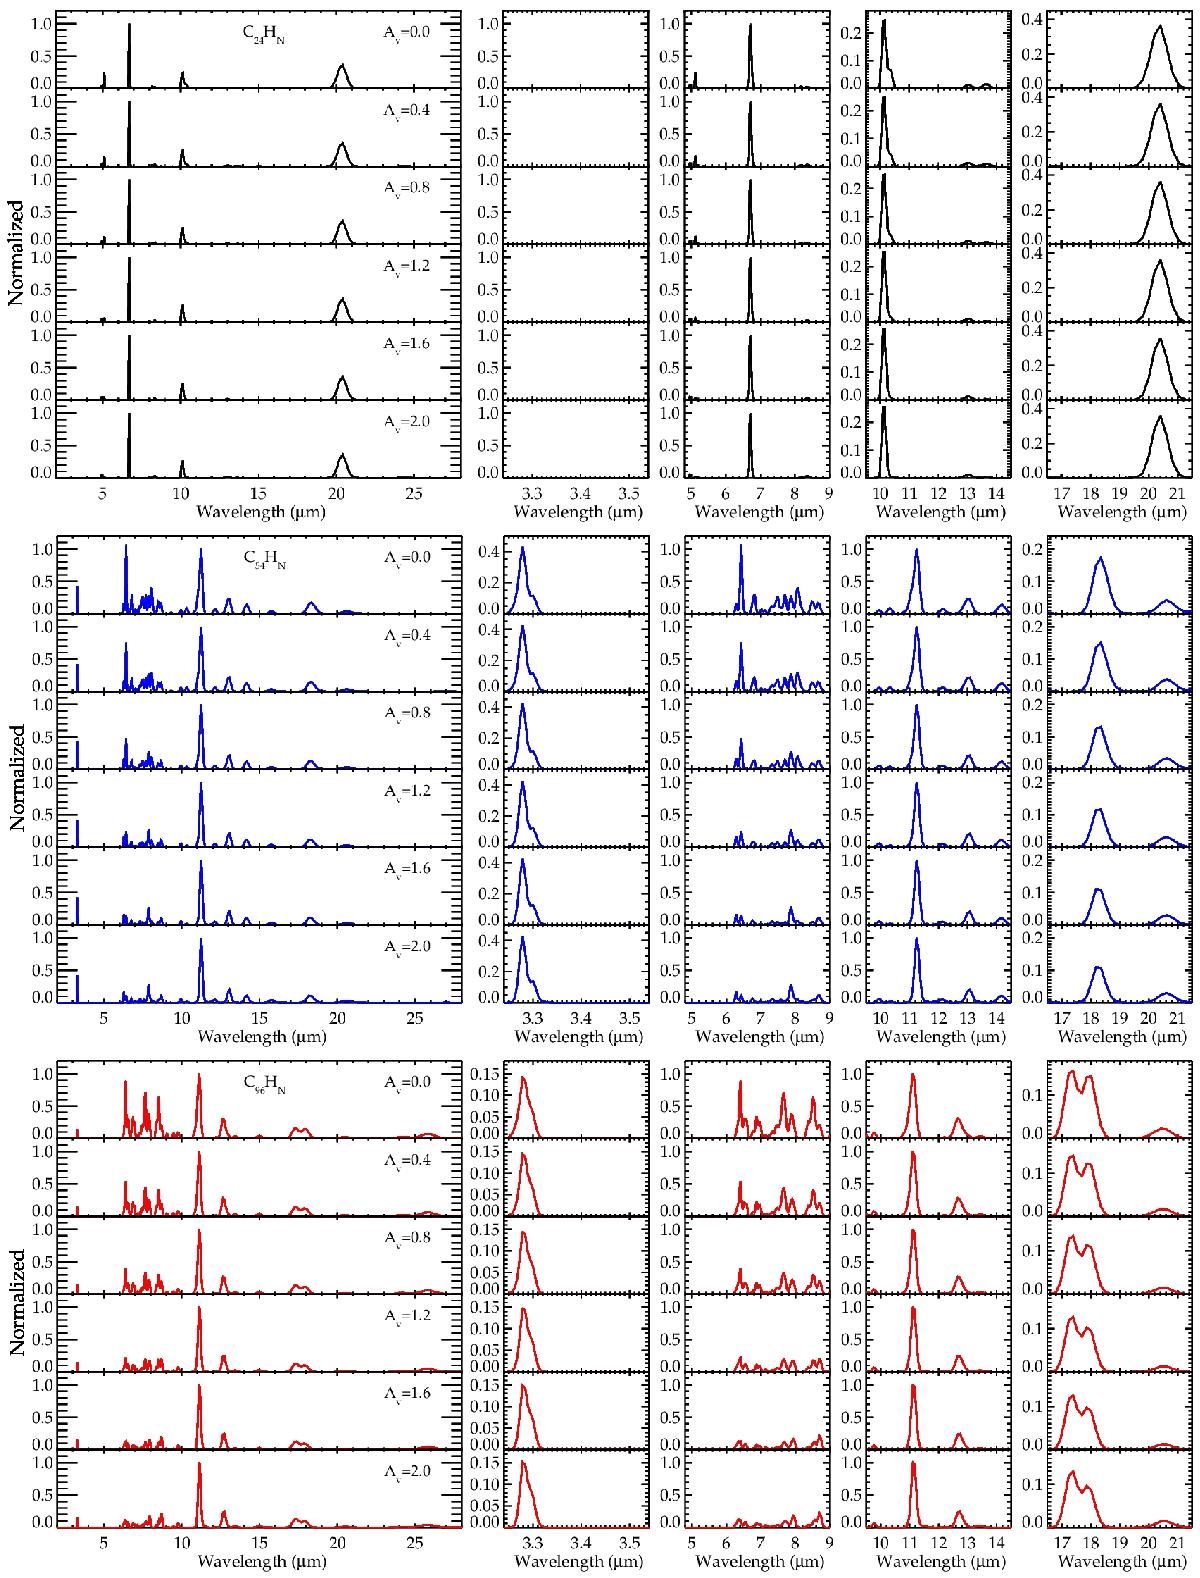
PAH emission spectra at different points inside the NW PDR of NGC 7023. For each species, the spectra have been derived by adding the contributions of all ionization and hydrogenation states, from the abundances presented in Appendix D. The results for C24H12 derivatives are shown in black, while the spectra for C54H18 and C96H24 species are shown in blue and red, respectively. The spectra have been conveniently normalized to the peak intensity of the 6.7 μm band for C24H12 derivatives, and to the 11.2 μm band for the larger species.
Current usage metrics show cumulative count of Article Views (full-text article views including HTML views, PDF and ePub downloads, according to the available data) and Abstracts Views on Vision4Press platform.
Data correspond to usage on the plateform after 2015. The current usage metrics is available 48-96 hours after online publication and is updated daily on week days.
Initial download of the metrics may take a while.