Fig. 1
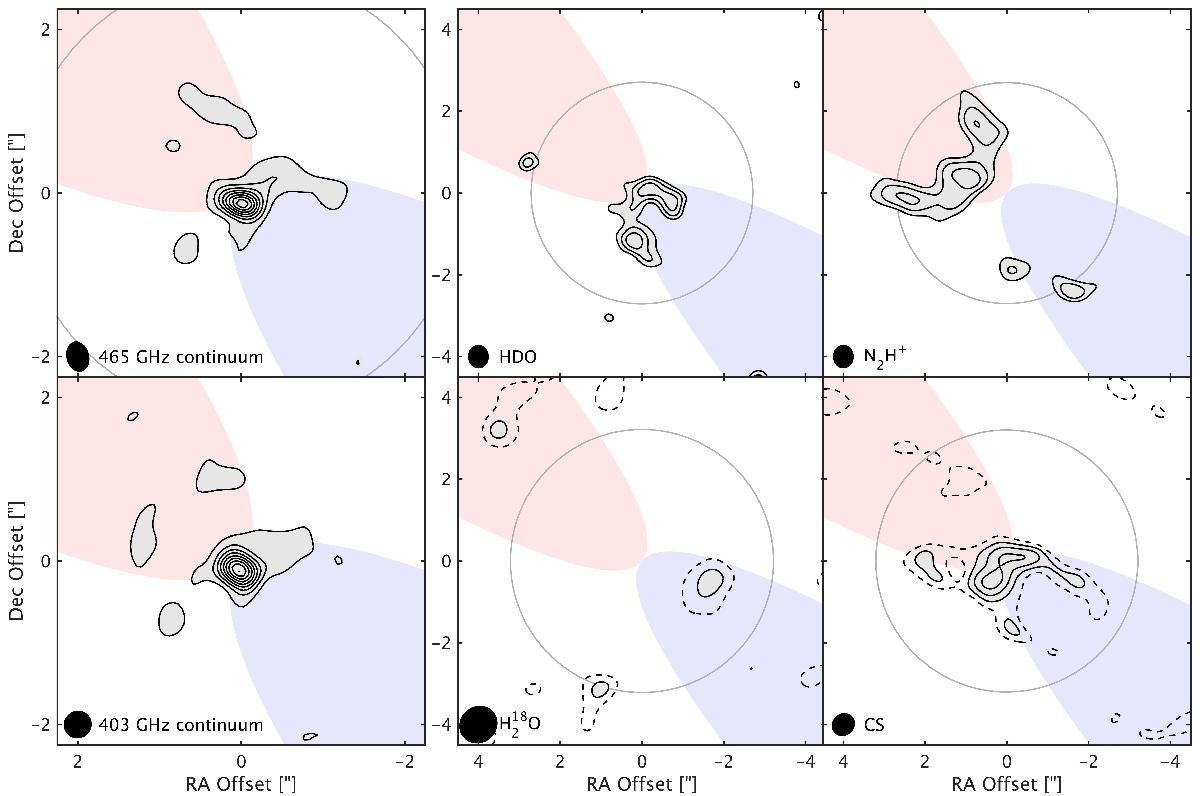
Continuum and integrated line emission maps towards IRAS 15398–3359, centred on α2000 = 15h43m02![]() 24, δ2000 = –34°09′06.7′′. The lines are integrated over a velocity range of Δυ = 0.75 km s-1 (except for H
24, δ2000 = –34°09′06.7′′. The lines are integrated over a velocity range of Δυ = 0.75 km s-1 (except for H![]() O, where Δυ = 2.00 km s-1 has been used). Contours are from 3σ in steps of 1σ. For H
O, where Δυ = 2.00 km s-1 has been used). Contours are from 3σ in steps of 1σ. For H![]() O and CS, the 2σ level is also indicated with dashed contours. The red and blue shaded regions mark the directions of the outflow cones (same geometry as in the models discussed in Sect. 4.2). The 90-percent level of the beam profile is indicated with a circle in each panel. The beam is shown in the lower left corner of each map. The continuum maps are zoomed-in by a factor of two.
O and CS, the 2σ level is also indicated with dashed contours. The red and blue shaded regions mark the directions of the outflow cones (same geometry as in the models discussed in Sect. 4.2). The 90-percent level of the beam profile is indicated with a circle in each panel. The beam is shown in the lower left corner of each map. The continuum maps are zoomed-in by a factor of two.
Current usage metrics show cumulative count of Article Views (full-text article views including HTML views, PDF and ePub downloads, according to the available data) and Abstracts Views on Vision4Press platform.
Data correspond to usage on the plateform after 2015. The current usage metrics is available 48-96 hours after online publication and is updated daily on week days.
Initial download of the metrics may take a while.