Free Access
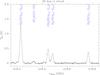
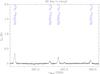
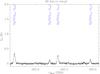
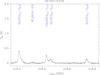
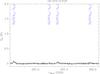
Fig. B.1
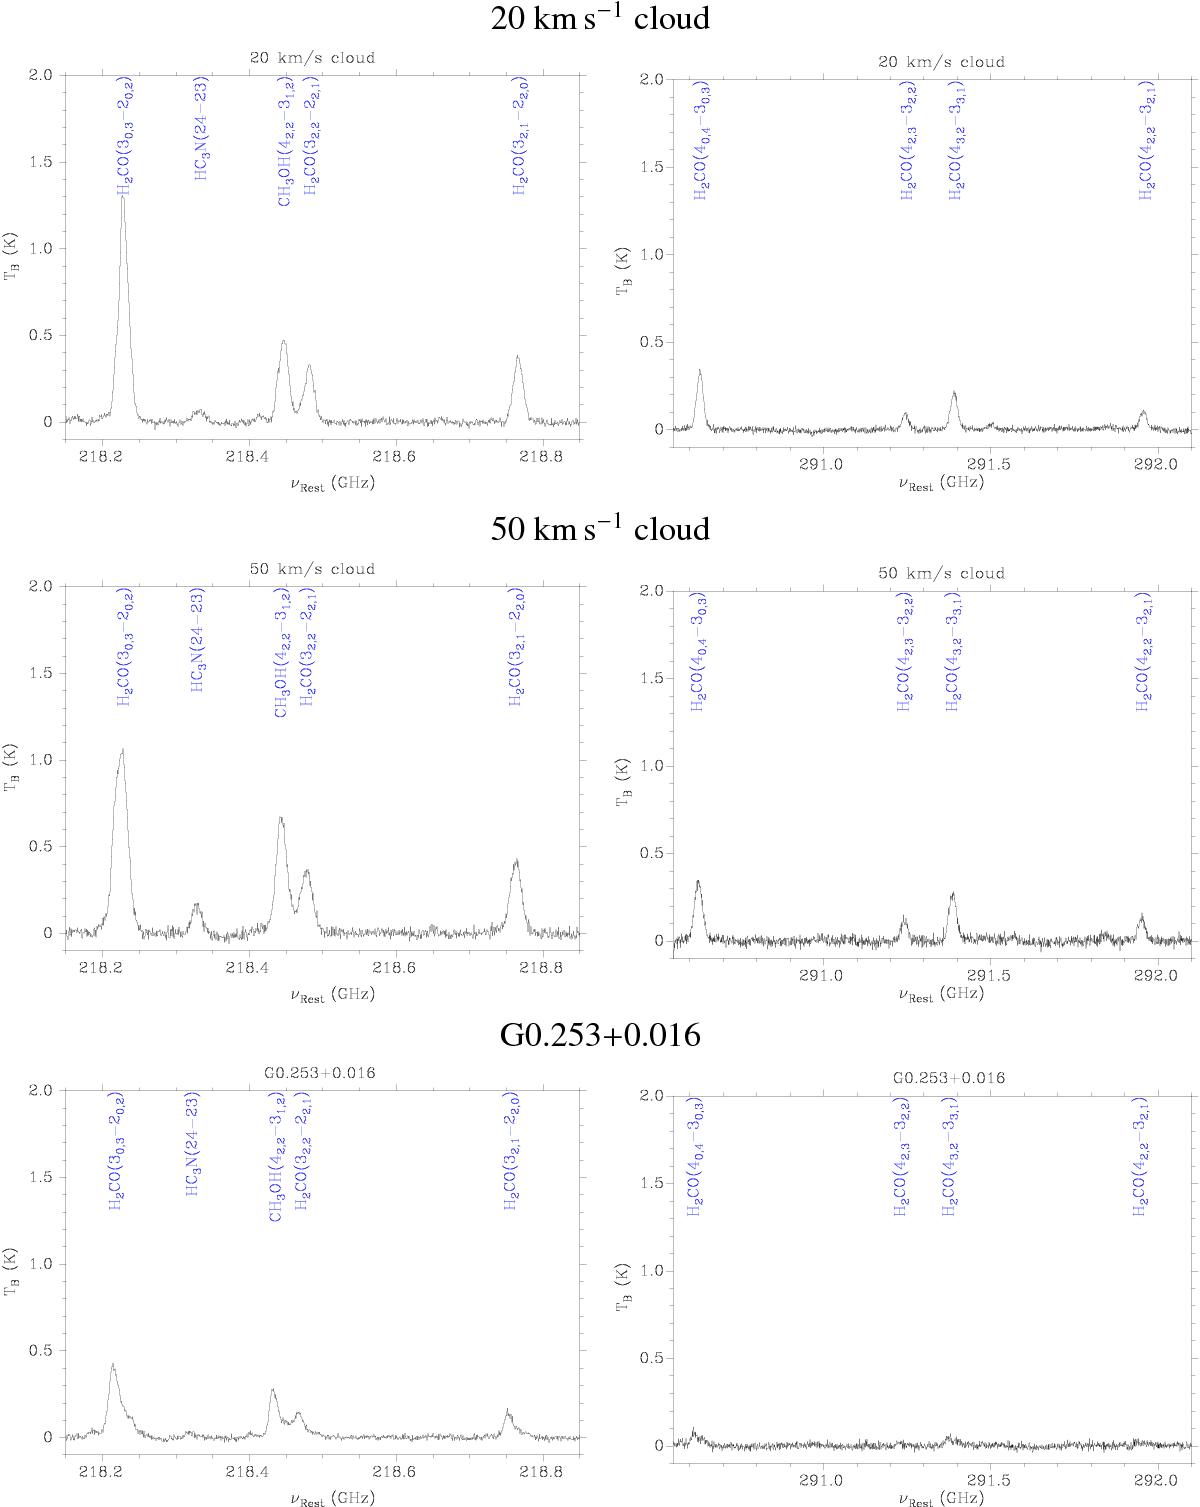
Spectra of para-H2CO transitions at 218 (left panels) and 291 GHz (right panels), averaged over the whole OTF map of each source. H2CO as well as other lines are marked in the spectra.
This figure is made of several images, please see below:
Current usage metrics show cumulative count of Article Views (full-text article views including HTML views, PDF and ePub downloads, according to the available data) and Abstracts Views on Vision4Press platform.
Data correspond to usage on the plateform after 2015. The current usage metrics is available 48-96 hours after online publication and is updated daily on week days.
Initial download of the metrics may take a while.