Fig. A.1
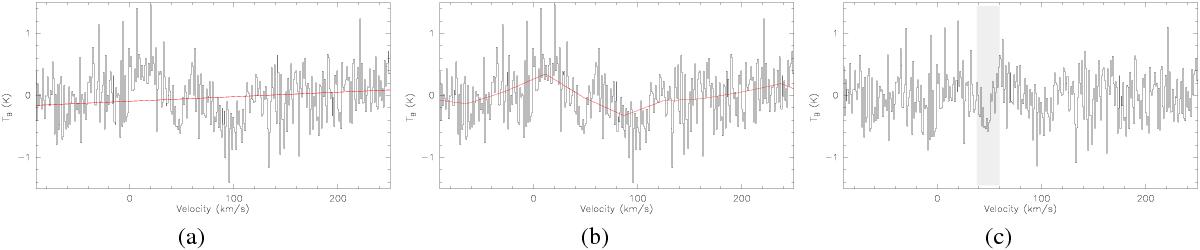
Example spectra of the H2CO(30,3 −20,2) transition of target G0.253+0.016 to show the spline-fitting of bad baselines. Left: input spectrum showing a bad baseline. The red line shows a linear baseline for comparison. Middle: input spectrum with the spline spectrum (red) overlayed. Right: baseline-subtracted spectrum. The gray box shows a baseline feature that was not removed in the spline-fitting due to its narrow width.
Current usage metrics show cumulative count of Article Views (full-text article views including HTML views, PDF and ePub downloads, according to the available data) and Abstracts Views on Vision4Press platform.
Data correspond to usage on the plateform after 2015. The current usage metrics is available 48-96 hours after online publication and is updated daily on week days.
Initial download of the metrics may take a while.