Fig. 5
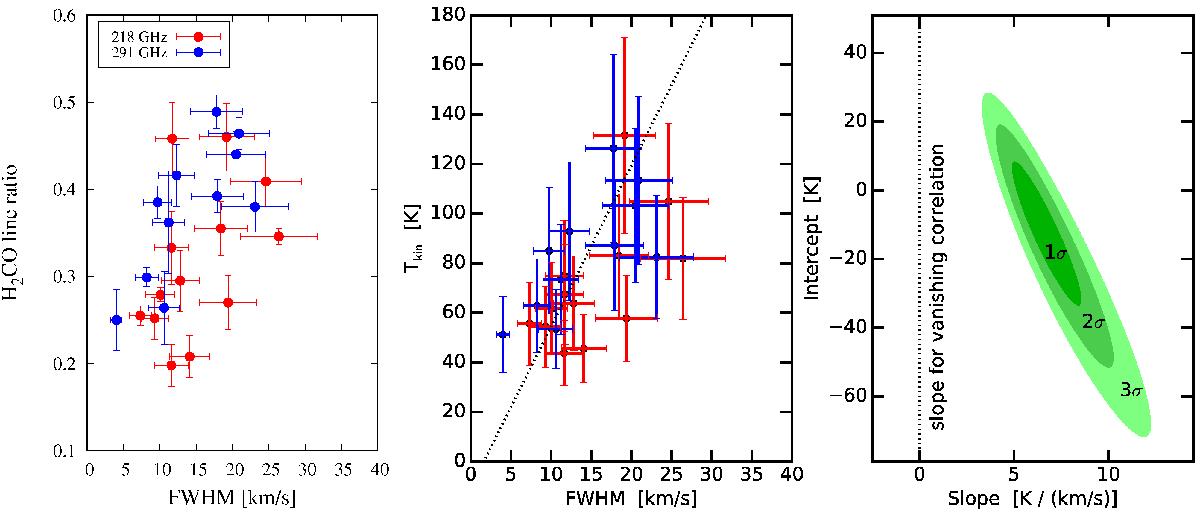
Left and middle panels: correlation plots of H2CO integrated intensity ratio and kinetic temperature, respectively vs. line width. The error bars present the standard deviation of the weighted average for the integrated intensity ratio, 20% uncertainty in the line width and 30% uncertainty in the temperature. The best linear fit to the temperature data using the total least-square method (Vanderplas et al. 2012) is shown as the solid line. Right panel: The possible slope and intercept values with the 1, 2, and 3σ likelihood contours.
Current usage metrics show cumulative count of Article Views (full-text article views including HTML views, PDF and ePub downloads, according to the available data) and Abstracts Views on Vision4Press platform.
Data correspond to usage on the plateform after 2015. The current usage metrics is available 48-96 hours after online publication and is updated daily on week days.
Initial download of the metrics may take a while.