Free Access
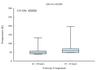
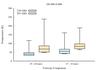
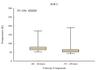
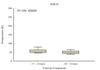
Fig. H.8
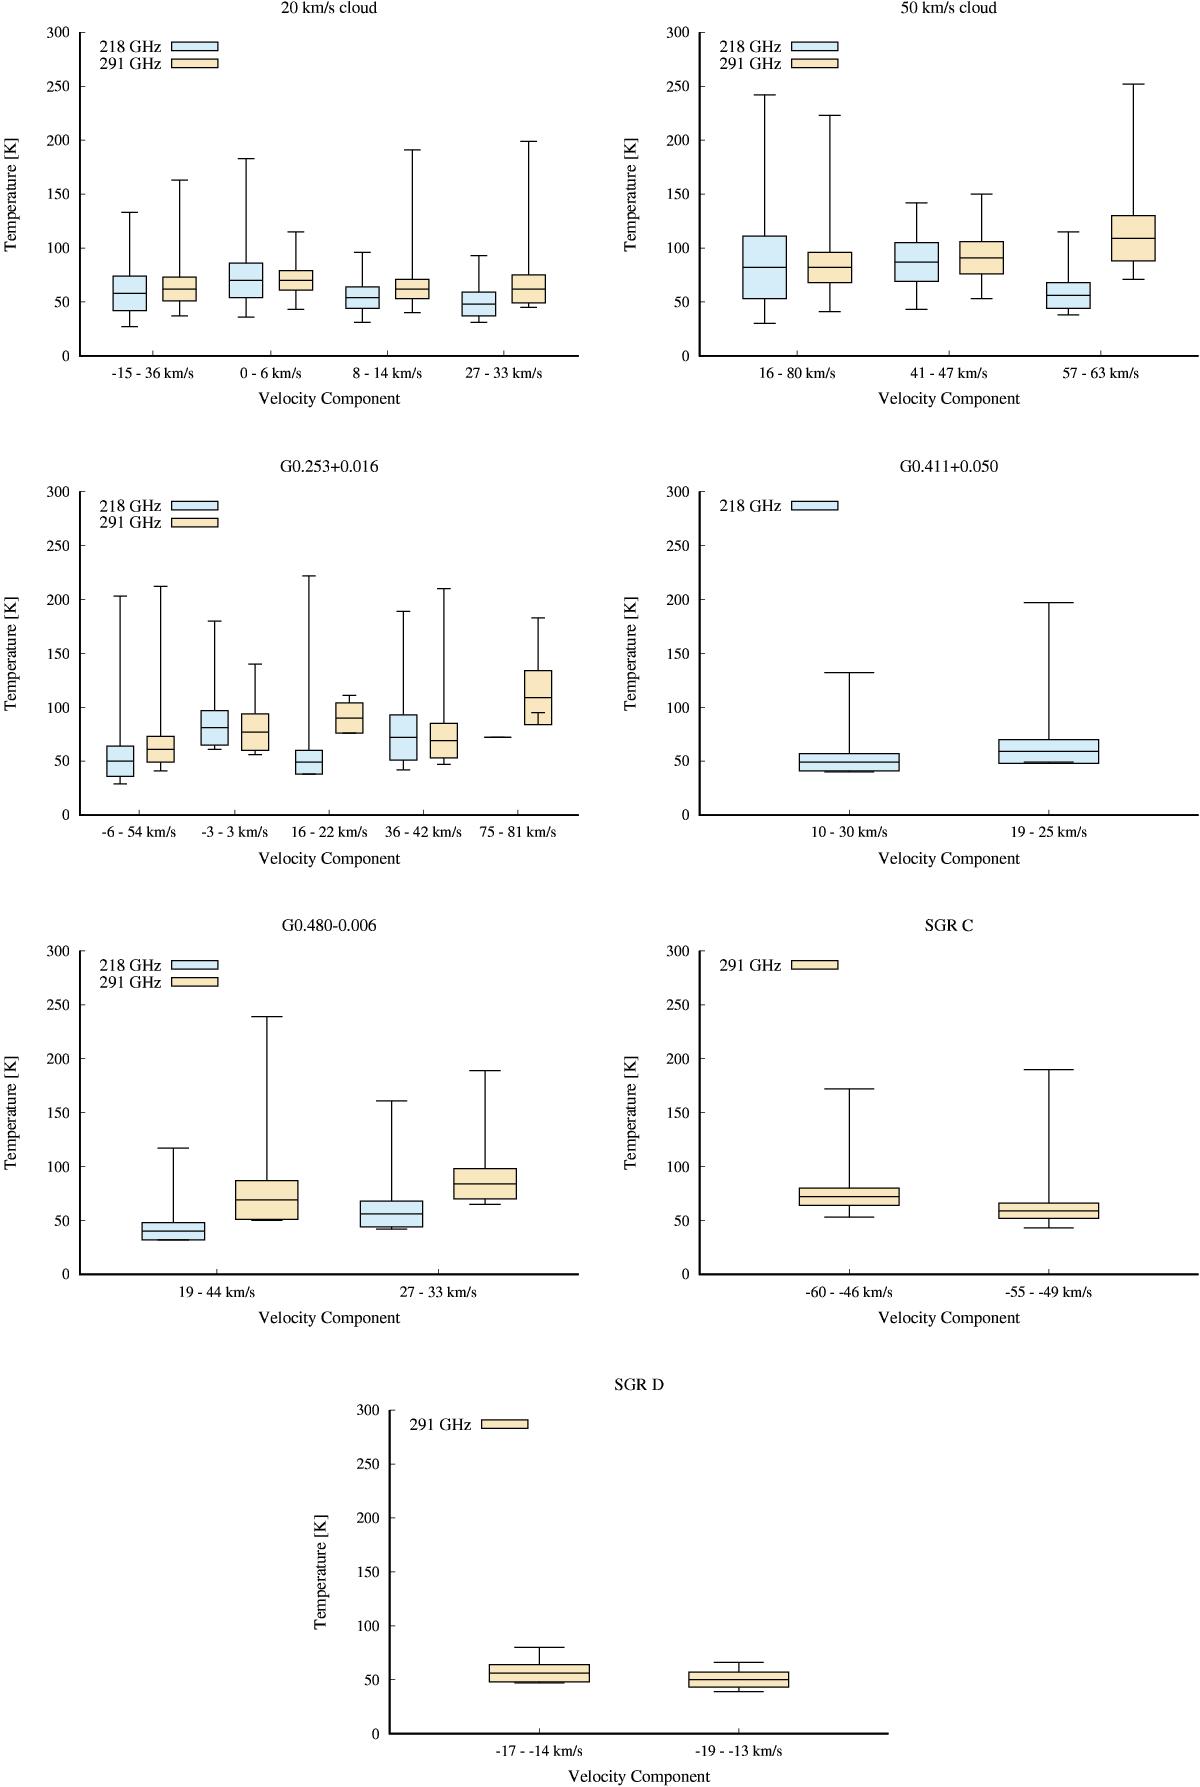
Minimal, weighted average, and maximal temperatures of the temperature maps of our seven sources. The vertical size of the boxes is given by the weighted average of the temperature ±1σ uncertainty. The values are taken from Table 3. Blue and yellow boxes show the results at 218 and 291 GHz, respectively.
This figure is made of several images, please see below:
Current usage metrics show cumulative count of Article Views (full-text article views including HTML views, PDF and ePub downloads, according to the available data) and Abstracts Views on Vision4Press platform.
Data correspond to usage on the plateform after 2015. The current usage metrics is available 48-96 hours after online publication and is updated daily on week days.
Initial download of the metrics may take a while.