Free Access
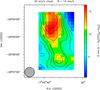
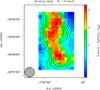
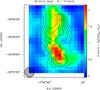
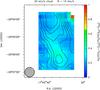
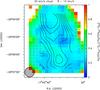
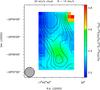
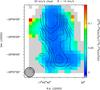
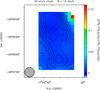
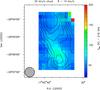
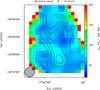
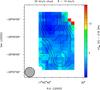
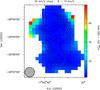
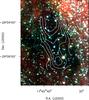
Fig. 4
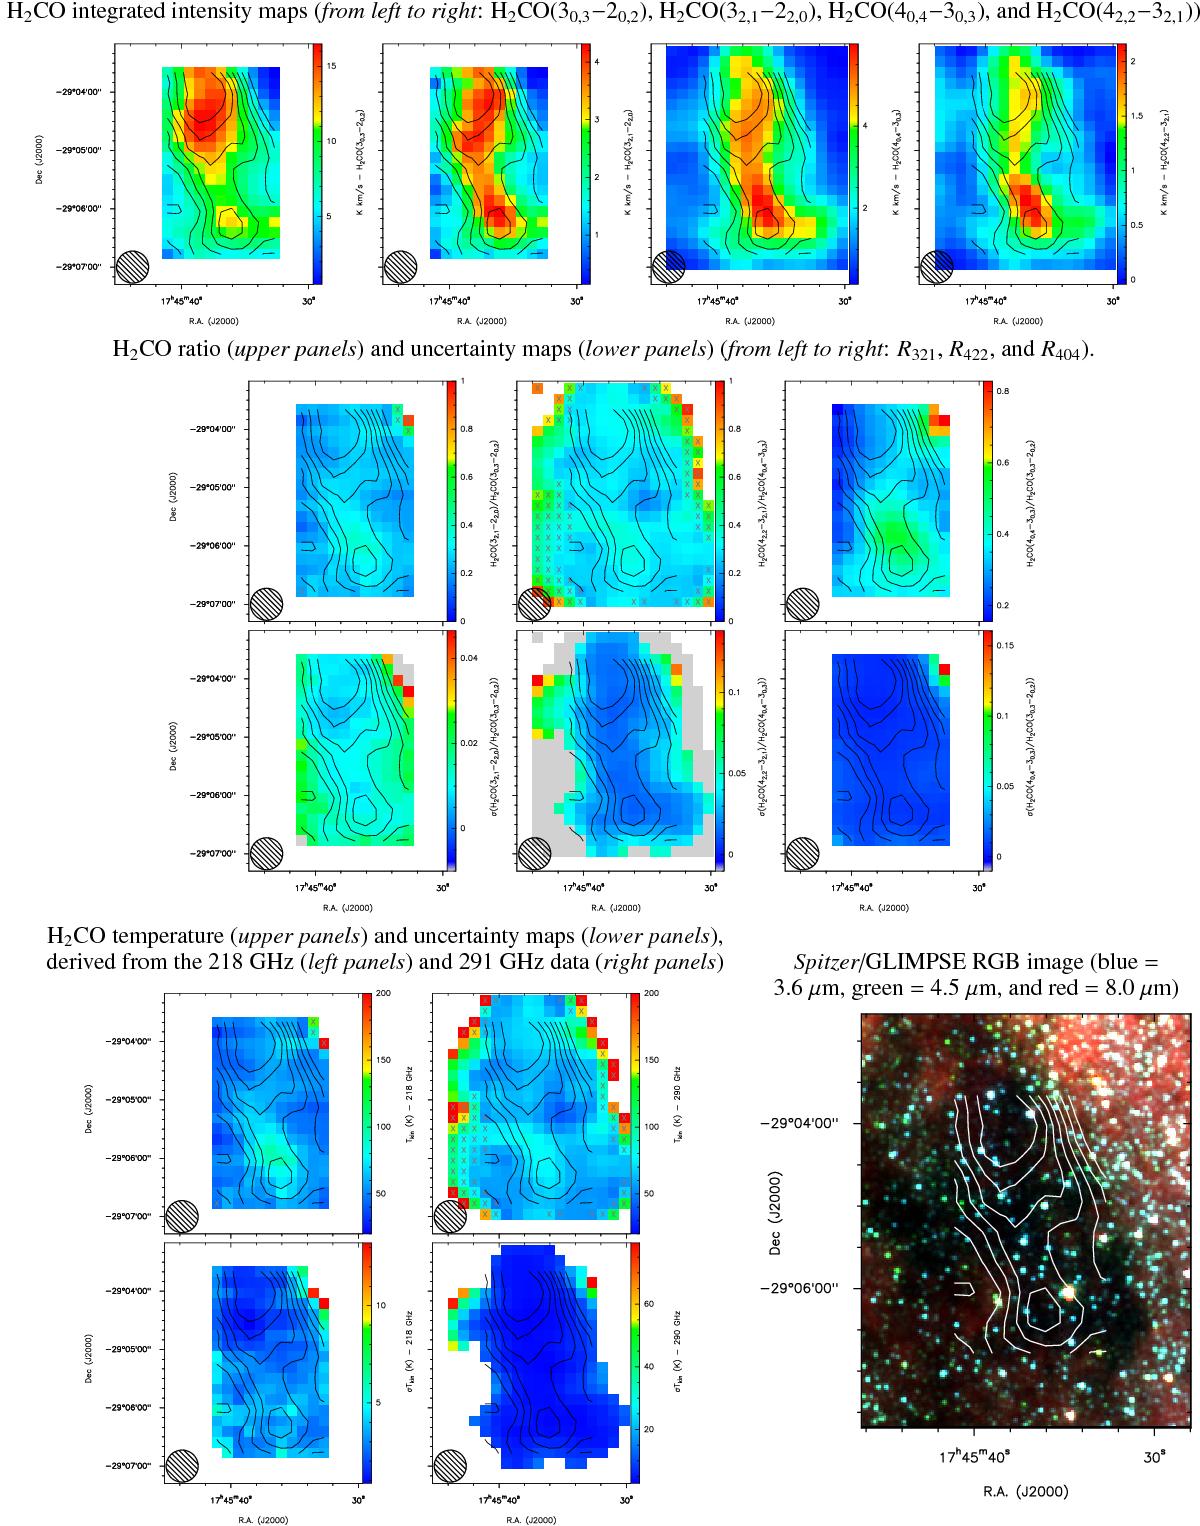
Summary of the produced maps for the 8−14 km s-1 component of the 20 km s-1 cloud. The contours show the moment 0 map of the H2CO(30,3 −20,2) transition, produced over the whole velocity range of the source (levels: 30−90% of the maximum in steps of 10%). The circle in the lower left corner shows the 33″ beam.
This figure is made of several images, please see below:

Current usage metrics show cumulative count of Article Views (full-text article views including HTML views, PDF and ePub downloads, according to the available data) and Abstracts Views on Vision4Press platform.
Data correspond to usage on the plateform after 2015. The current usage metrics is available 48-96 hours after online publication and is updated daily on week days.
Initial download of the metrics may take a while.