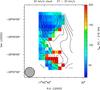
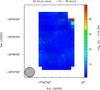
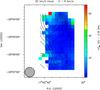
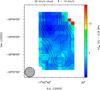
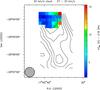
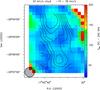
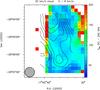
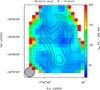
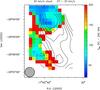
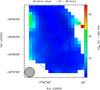
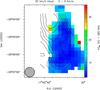
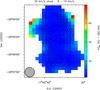
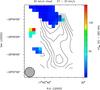
Fig. H.1
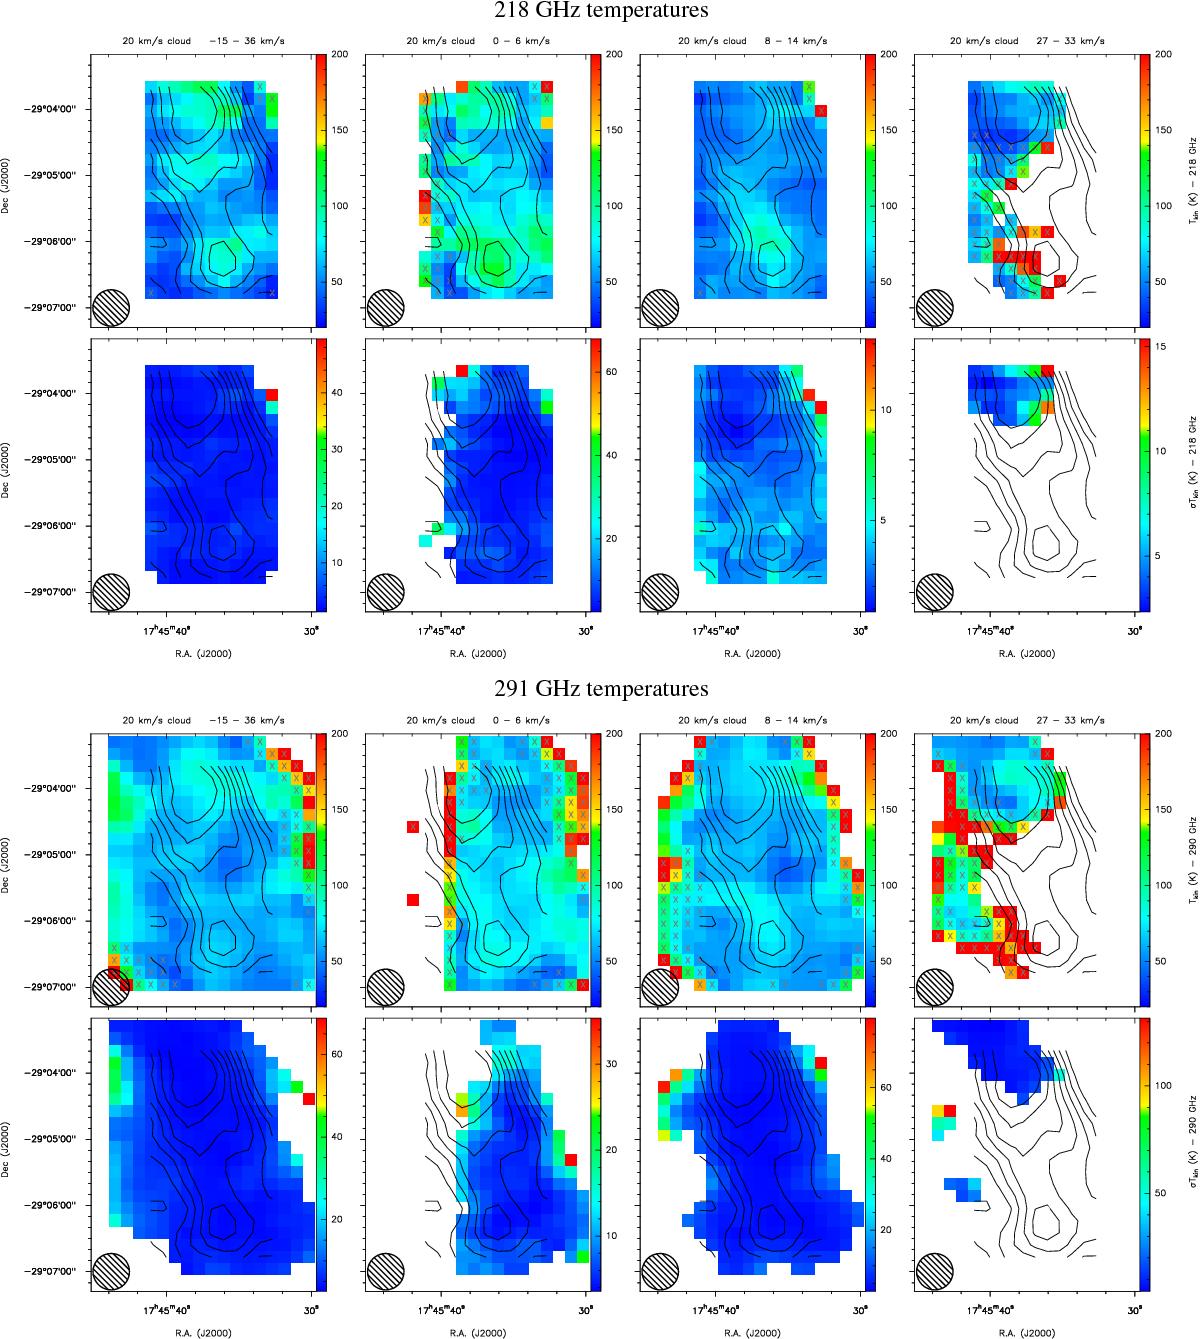
Temperature (upper panels) and uncertainty (lower panels) maps of the 20 km s-1 cloud (contours as in Fig. E.1). Upper limits of the temperatures are marked with Xs. The corresponding pixels in the uncertainty maps are blanked. The purple squares present the areas over which the emission of the main H2CO line was integrated to determine the line width, as well as the average temperature (see Sect. 5.3). The circle in the lower left corner shows the 33″ beam.
Current usage metrics show cumulative count of Article Views (full-text article views including HTML views, PDF and ePub downloads, according to the available data) and Abstracts Views on Vision4Press platform.
Data correspond to usage on the plateform after 2015. The current usage metrics is available 48-96 hours after online publication and is updated daily on week days.
Initial download of the metrics may take a while.