Fig. G.2
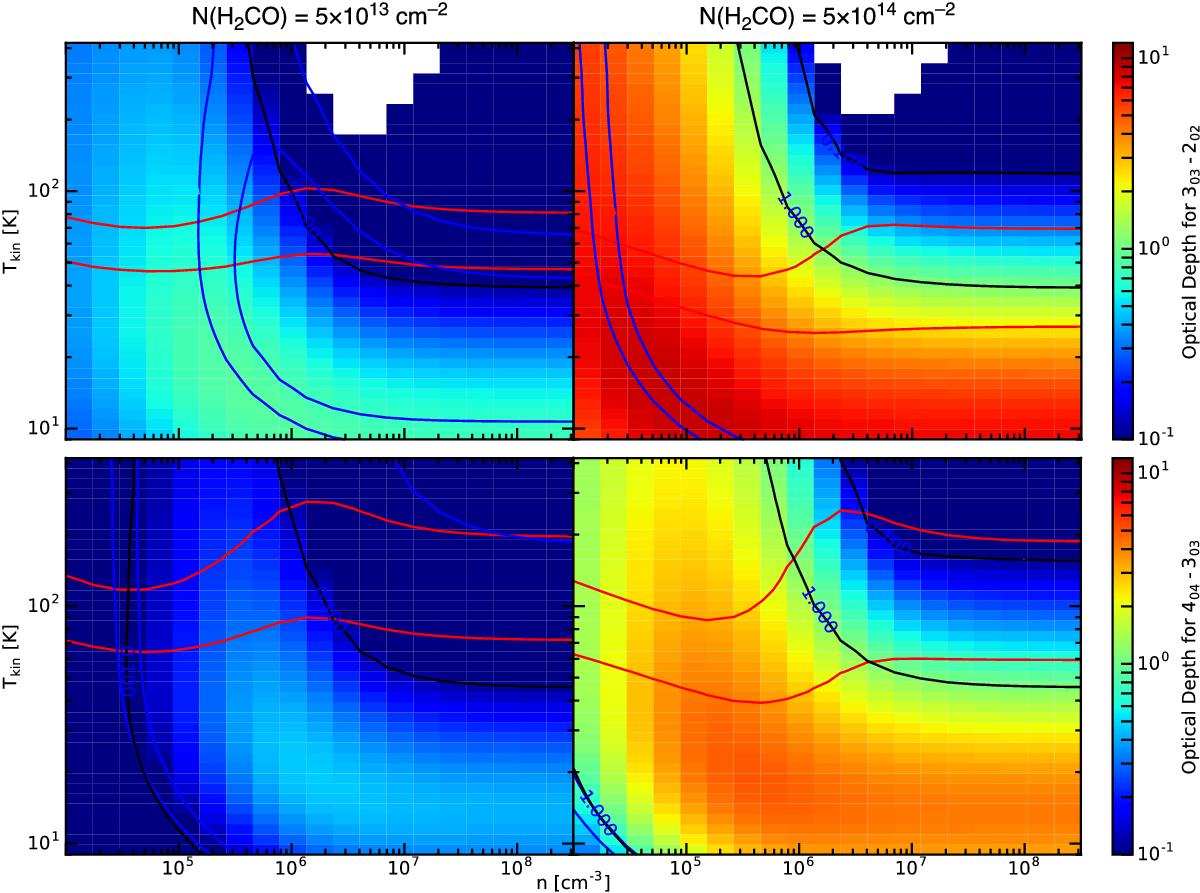
Impact of line optical depth. The optical depths shown on the left are calculated for the fiducial case (see Sect. 4.2), while those on the right are for an increased column density of 5 × 1014 cm-2. The red lines indicate the observed line ratios of 0.25 (top panel) and 0.35 (bottom panel) at 218 and 291 GHz, respectively, in the 8−14 km s-1 slice of the 20 km s-1 cloud. The blue lines indicate an intensity of 15 K km s-1 at 218 GHz (top panel) and of 4 K km s-1 at 291 GHz (bottom panel), respectively, in the same slice. Black lines give optical depth contours. The lines come in pairs since we allow for ± 20% variation in drawing. Simultaneous fits to line ratios and intensities are found in locations where the blue and red lines intersect. At 218 GHz (top panel) these simultaneous matches require either relatively high densities (left panel) or high optical depths (right panel).
Current usage metrics show cumulative count of Article Views (full-text article views including HTML views, PDF and ePub downloads, according to the available data) and Abstracts Views on Vision4Press platform.
Data correspond to usage on the plateform after 2015. The current usage metrics is available 48-96 hours after online publication and is updated daily on week days.
Initial download of the metrics may take a while.