Fig. 3
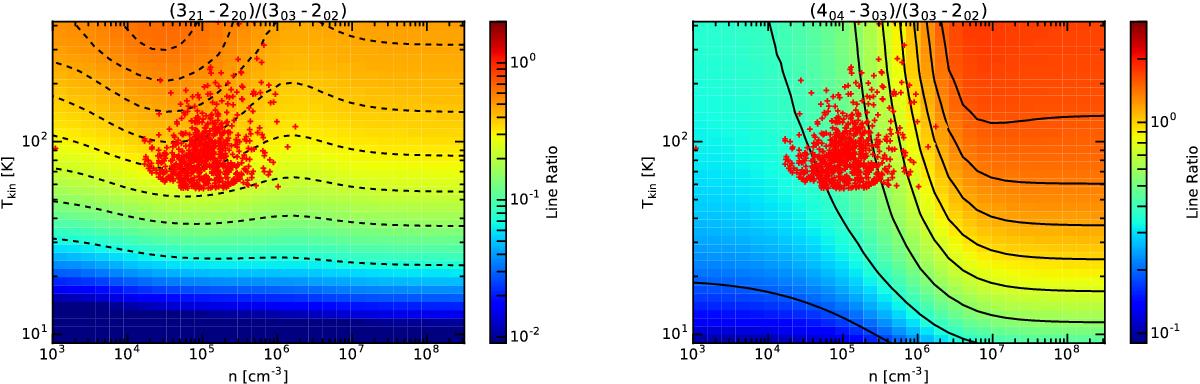
Left: R321 as a function of kinetic temperature Tkin and density n. The plot shows that the ratio is mostly dependent on temperature and independent of the density of the gas. Right: R404 as a function of kinetic temperature Tkin and density n. The plot shows the strong dependence of the ratio on both temperature and density for densities <107 cm-3. The red plus signs indicate locations where the observed line ratios R321 and R404 are matched at the same time.
Current usage metrics show cumulative count of Article Views (full-text article views including HTML views, PDF and ePub downloads, according to the available data) and Abstracts Views on Vision4Press platform.
Data correspond to usage on the plateform after 2015. The current usage metrics is available 48-96 hours after online publication and is updated daily on week days.
Initial download of the metrics may take a while.