Free Access
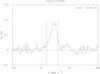
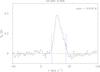
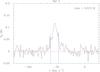
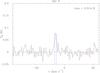
Fig. D.1
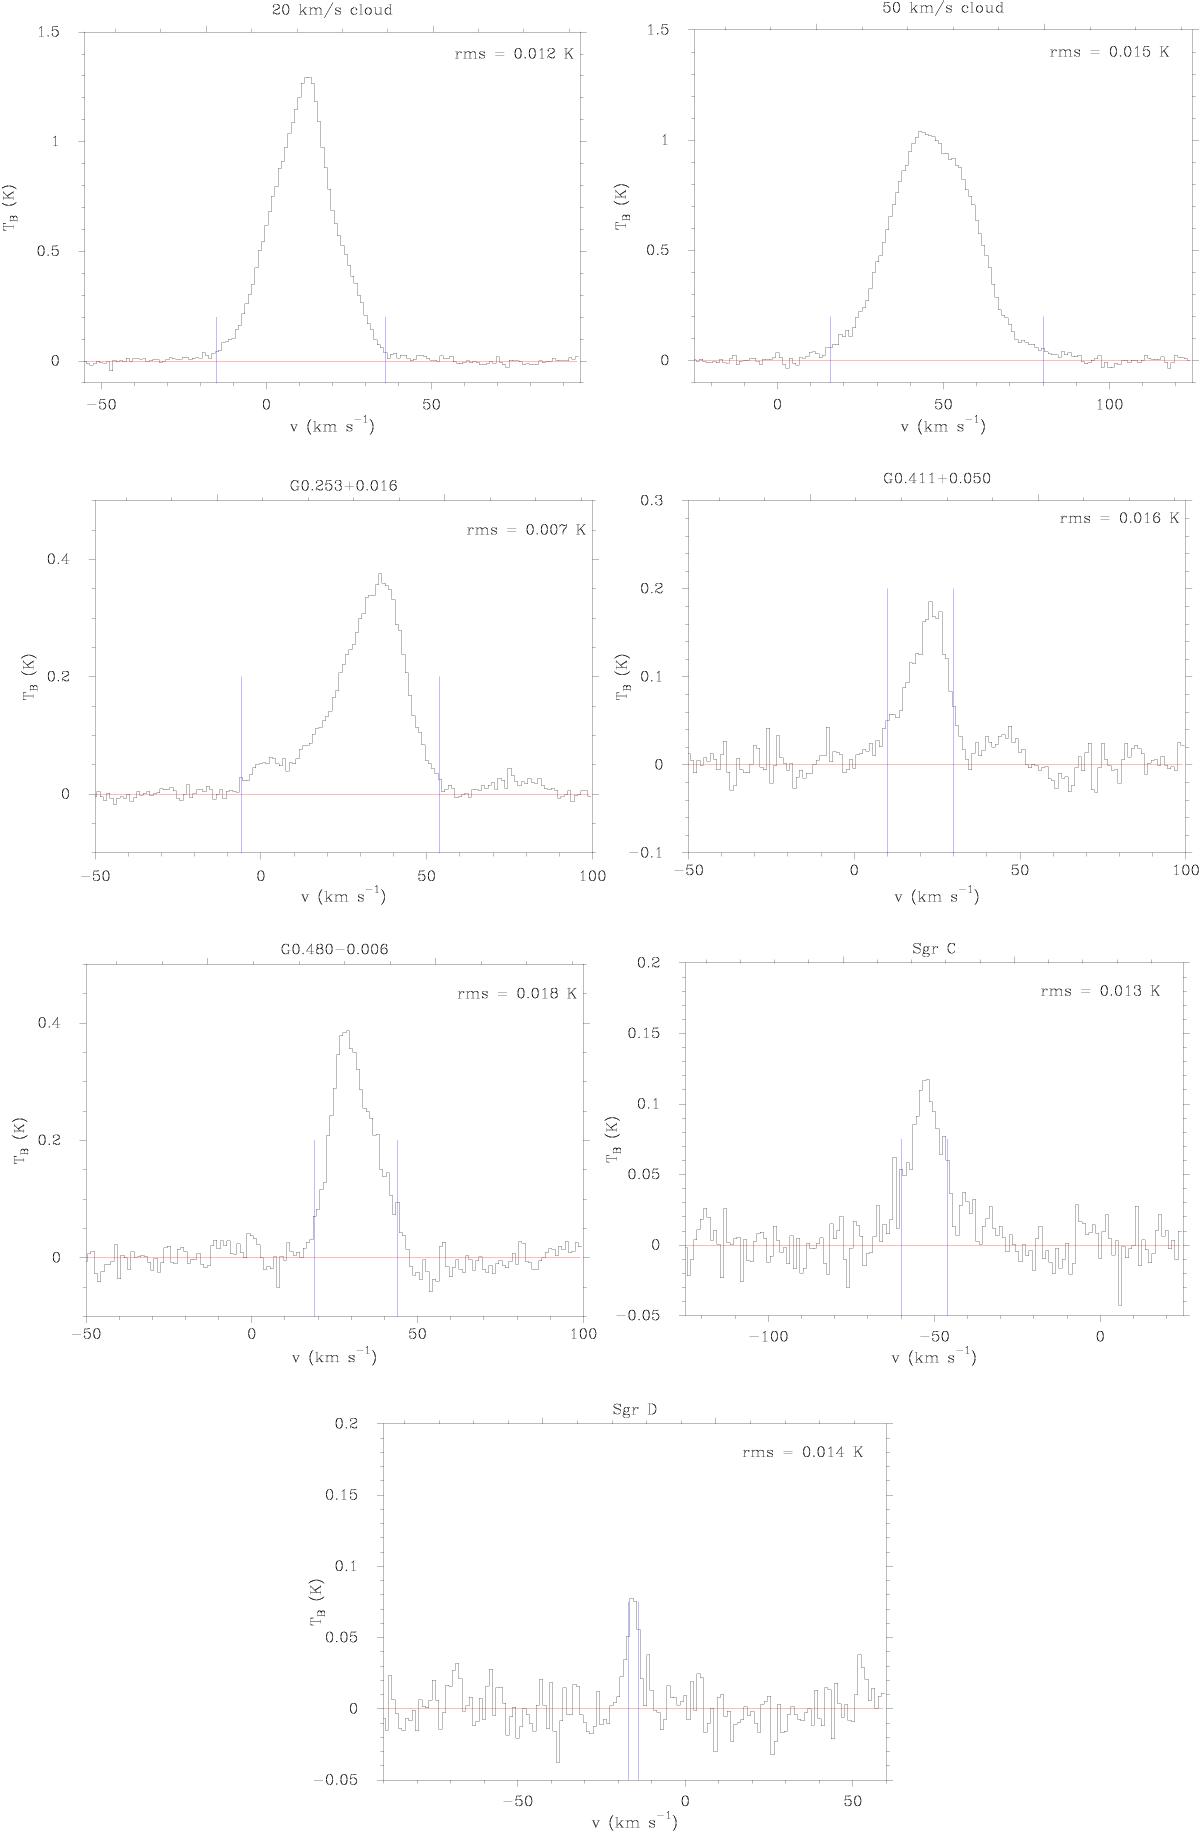
H2CO(30,3 −20,2) spectra, averaged over the whole OTF map of each source. The blue lines indicate the velocity range of the whole source where the line emission is above 3σ. The red line shows the fitted baseline (rms value in upper right corner).
This figure is made of several images, please see below:
Current usage metrics show cumulative count of Article Views (full-text article views including HTML views, PDF and ePub downloads, according to the available data) and Abstracts Views on Vision4Press platform.
Data correspond to usage on the plateform after 2015. The current usage metrics is available 48-96 hours after online publication and is updated daily on week days.
Initial download of the metrics may take a while.