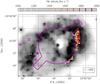
Fig. 7
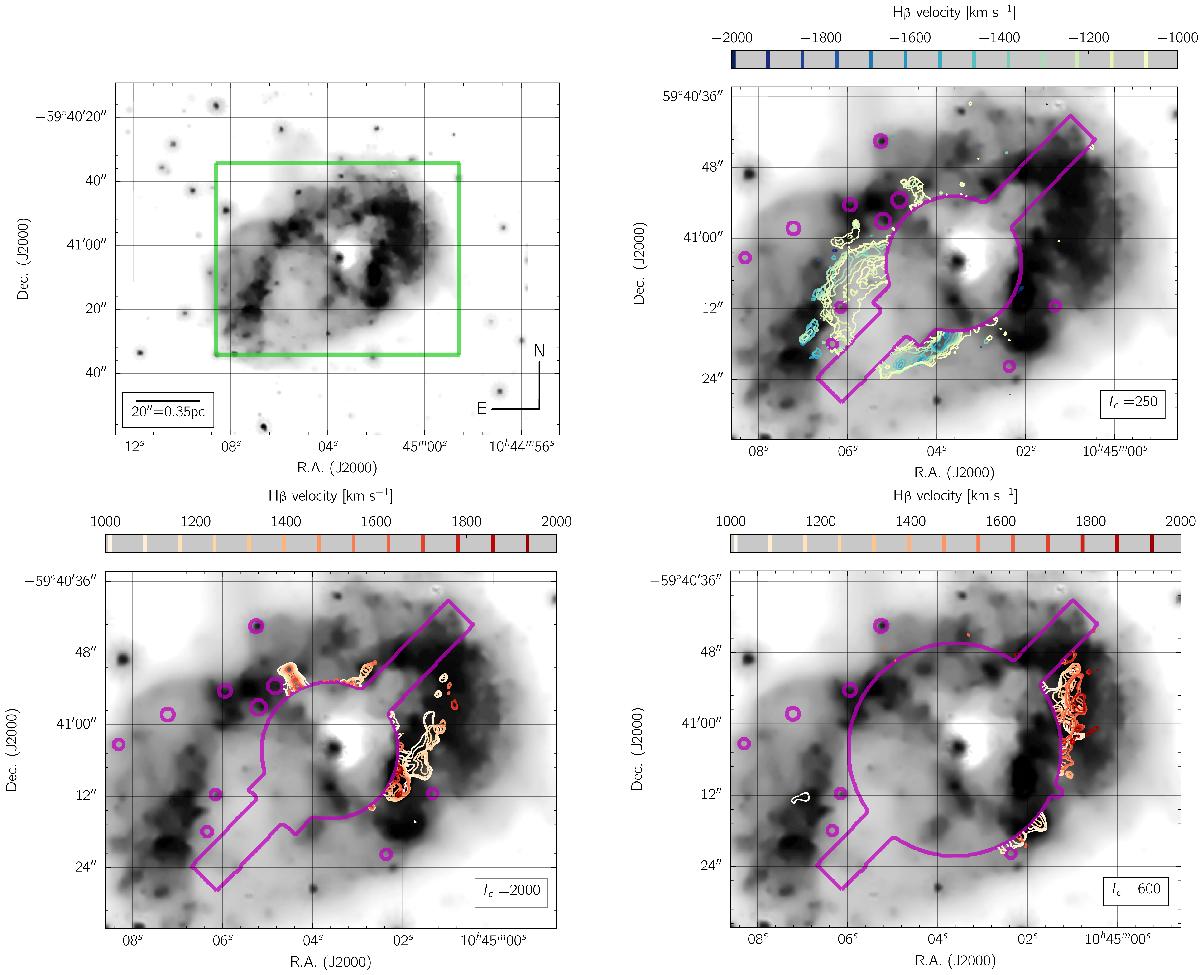
The 0.5–1.2 keV Chandra X-ray image (gray-scale image) overlaid with the Hβ velocity contours obtained from our MUSE data. Contours are fit in individual MUSE slices at an intensity level “Ic” in 10-20 erg/s/cm2/Å and color-coded as a function of velocity. The purple shapes indicate masked-out regions not used in this analysis that include the Homunculus, the artifacts from the optical ghosts described in Sect. 2, and several nearby stars. Because of the number of artifacts present and the faintness of the clumps, two different mask-out regions are used for the positive velocity contours. We also adjust the “Ic” value in each case. Upper left: extent of the soft X-ray emission surrounding η Car. The green box indicates the region shown in the other three panels. Upper right: contours of the blueshifted emission, highlighting the correlation of the optical emission with the soft X-rays in the southeast. The outer shell in the southeast coincides with the inner wall of the X-ray emission. Lower left and right: contours of the redshifted emission. The red part of the outer shell is fainter and it is difficult to determine the velocity contours of the ejecta due to artifacts, but the optical emission here also accurately traces the inner wall of the X-ray emission.
Current usage metrics show cumulative count of Article Views (full-text article views including HTML views, PDF and ePub downloads, according to the available data) and Abstracts Views on Vision4Press platform.
Data correspond to usage on the plateform after 2015. The current usage metrics is available 48-96 hours after online publication and is updated daily on week days.
Initial download of the metrics may take a while.