Fig. 2
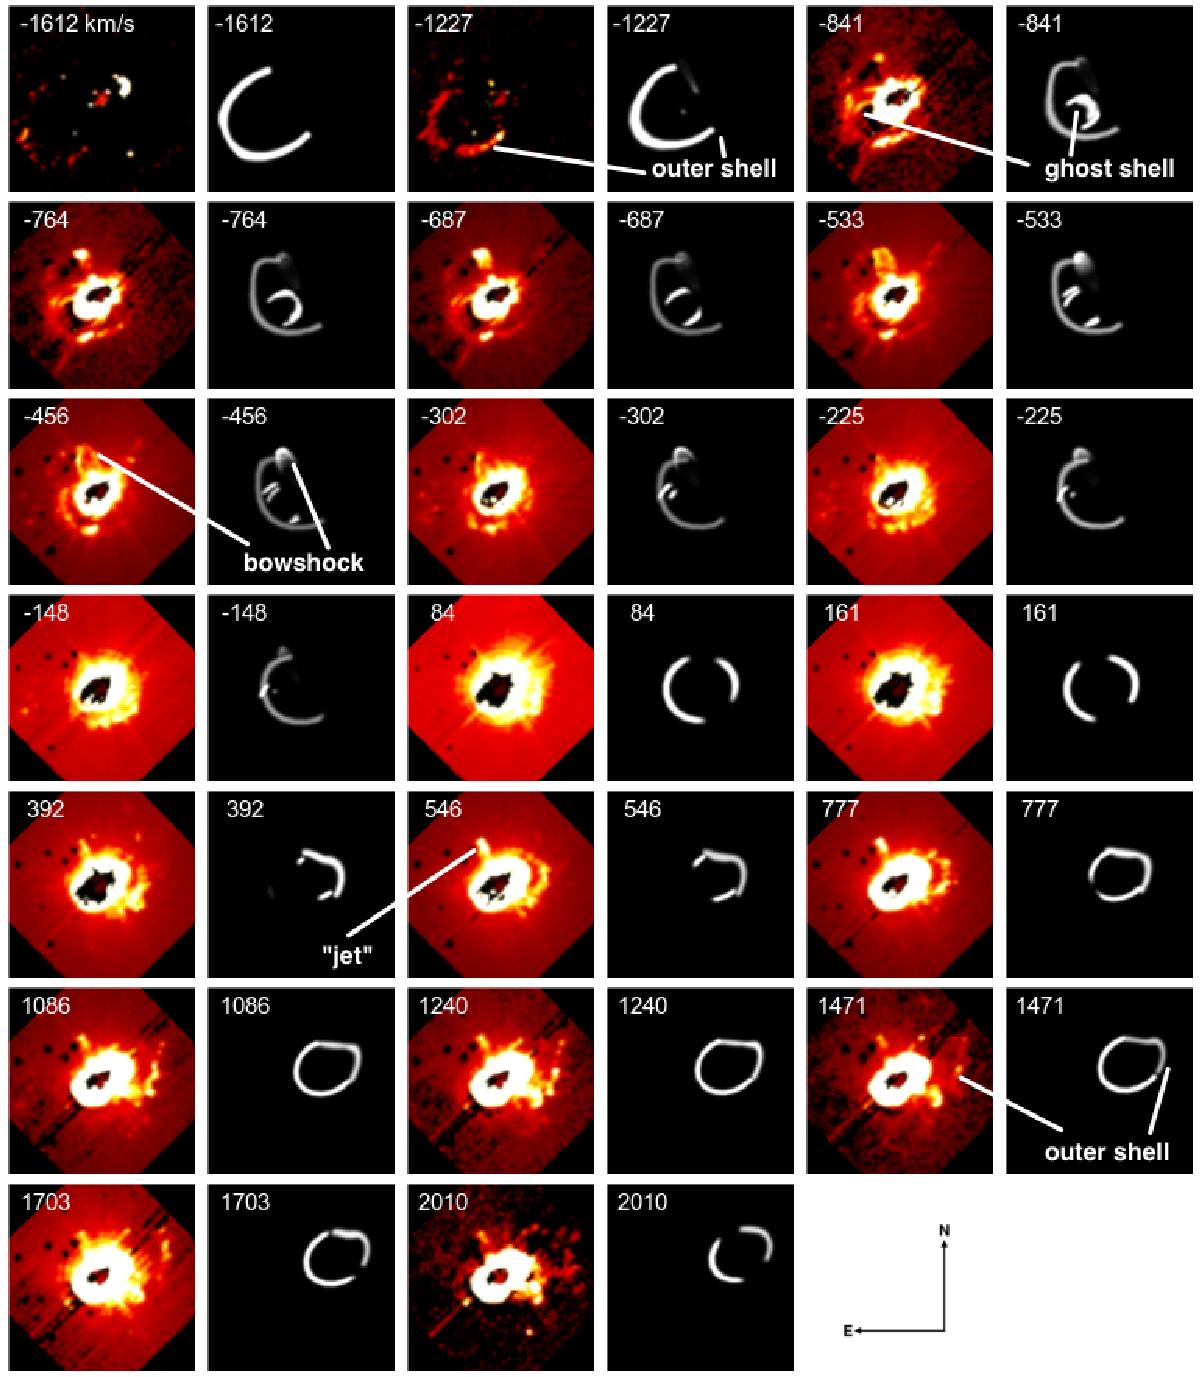
MUSE channel maps showing the observed Hβ emission in the MUSE field of view of 1′× 1′. Each panel shows a single channel of the MUSE data cube, corresponding to different velocities of the Hβ emission. The velocities are indicated in each panel in units of km s-1 (each channel map spans a range of approximately 80 km s-1, velocities are not corrected for η Car’s systemic heliocentric velocity of approximately −8 km s-1). The corresponding SHAPE model channel map is shown on the right side of each observational channel map (the grayscale only indicates the location of the emission and does not reproduce the brightness distribution), see text for details. The channel maps are irregularly spaced in velocity to show best the brightest emission features corresponding to the outer shell, the ghost shell, the bowshock, and the jet, identified by labels and arrows pointing toward the feature (see also Fig. 4 for their three-dimensional location). The jet is not modeled with SHAPE, since the origin of the emission is not clear, see Sect. 3.4. The central star and part of the Homunculus are saturated. The channel maps are presented with a square-root color stretch and normalized in flux individually to peak intensity. They only contain physical information on the structure and velocities, but do not permit channel-to-channel comparisons of the fluxes to be made.
Current usage metrics show cumulative count of Article Views (full-text article views including HTML views, PDF and ePub downloads, according to the available data) and Abstracts Views on Vision4Press platform.
Data correspond to usage on the plateform after 2015. The current usage metrics is available 48-96 hours after online publication and is updated daily on week days.
Initial download of the metrics may take a while.