Fig. 5
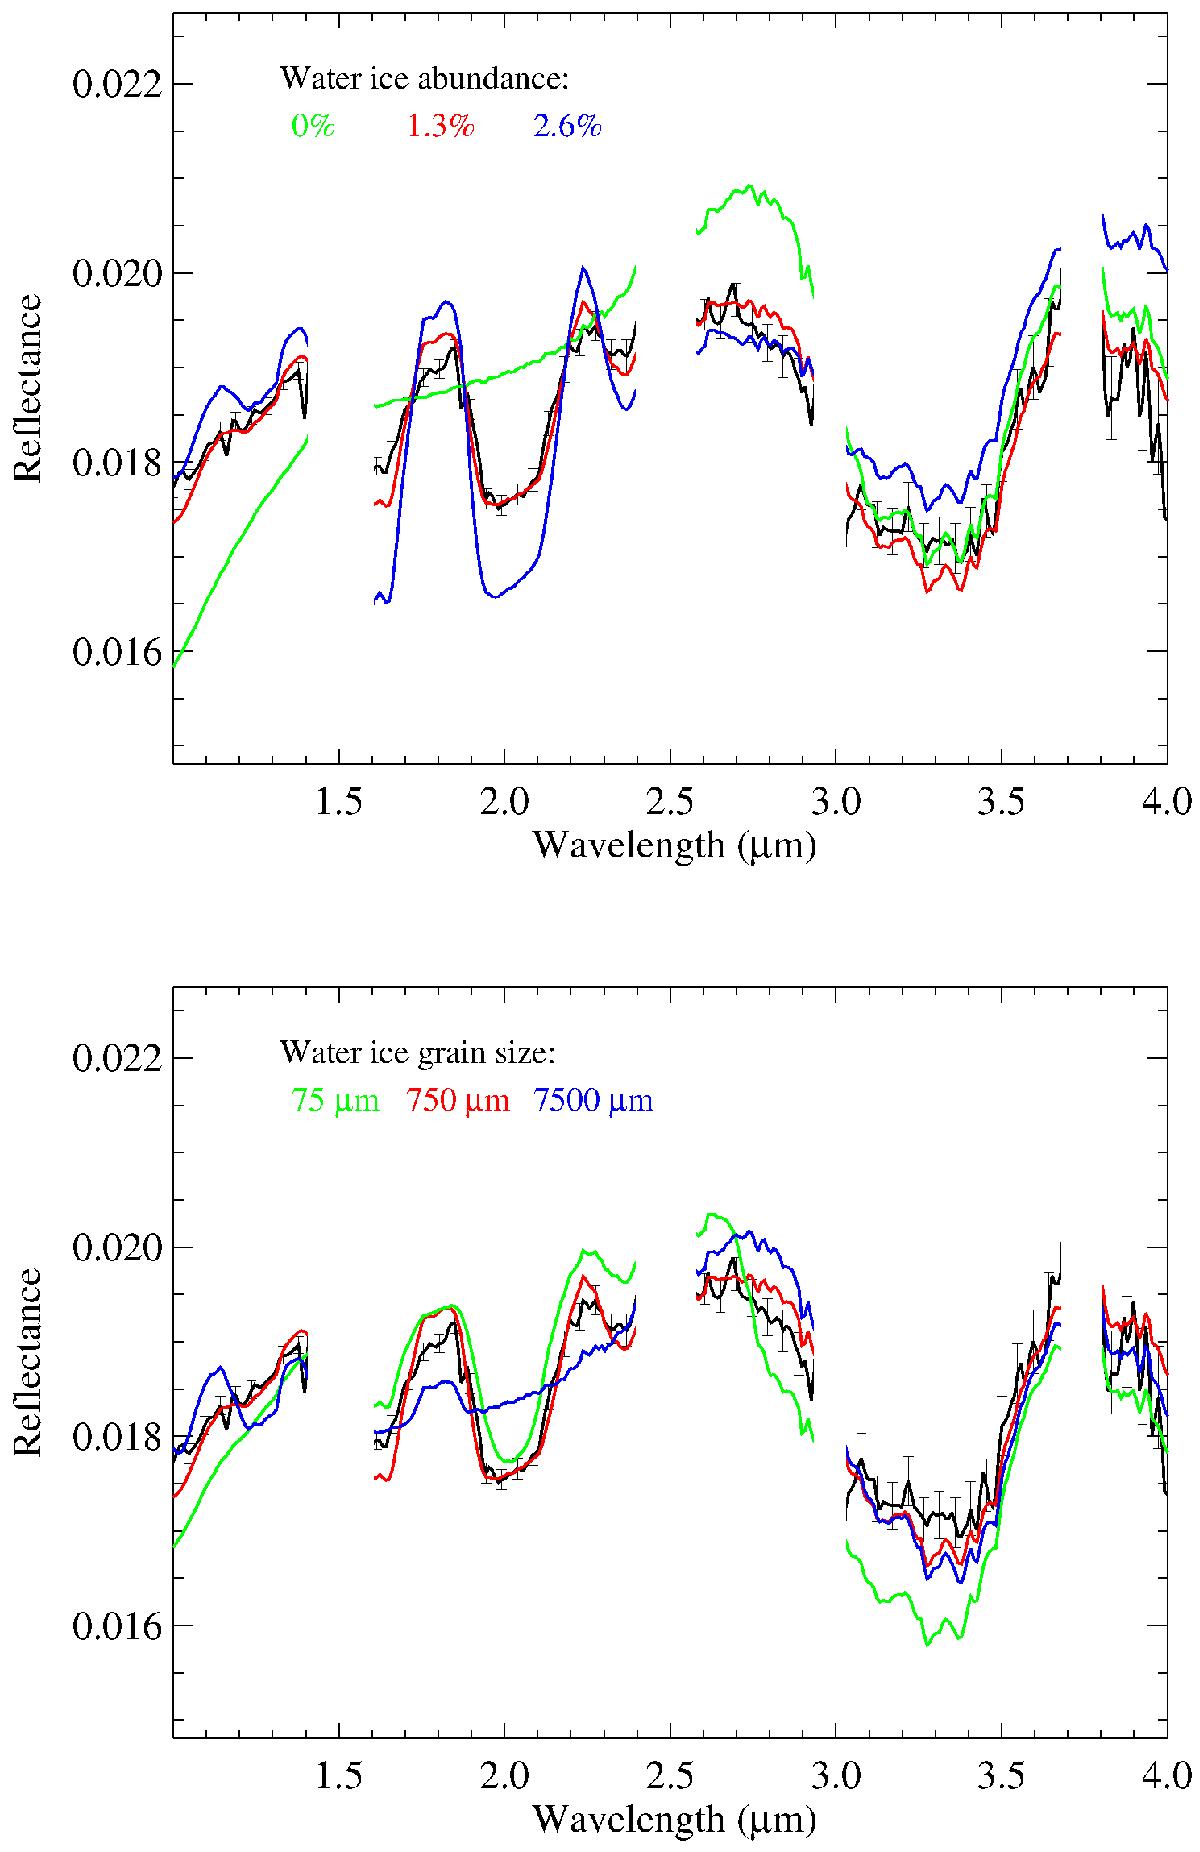
Simulated reflectance spectra are shown to highlight the effect of variation in abundance and grain size of the water ice. In both plots, the black curve is the spectrum of spot 3, and the red curve is the best fit for areal mixture case already reported in Fig. 4. The green and blue curves are simulated by varying one of these parameters, as indicated: the panel on the top shows the effect of the variation in abundance of H2O ice (0%, 1.3%, 2.6%) fixing the grain size at 750 μm, and the panel on the bottom shows the variation in grain size (75 μm, 750 μm, 7500 μm), fixing the H2O ice abundance at 1.3%. The gaps in the spectral ranges are not taken into account, as in Fig. 3.
Current usage metrics show cumulative count of Article Views (full-text article views including HTML views, PDF and ePub downloads, according to the available data) and Abstracts Views on Vision4Press platform.
Data correspond to usage on the plateform after 2015. The current usage metrics is available 48-96 hours after online publication and is updated daily on week days.
Initial download of the metrics may take a while.