Fig. 4
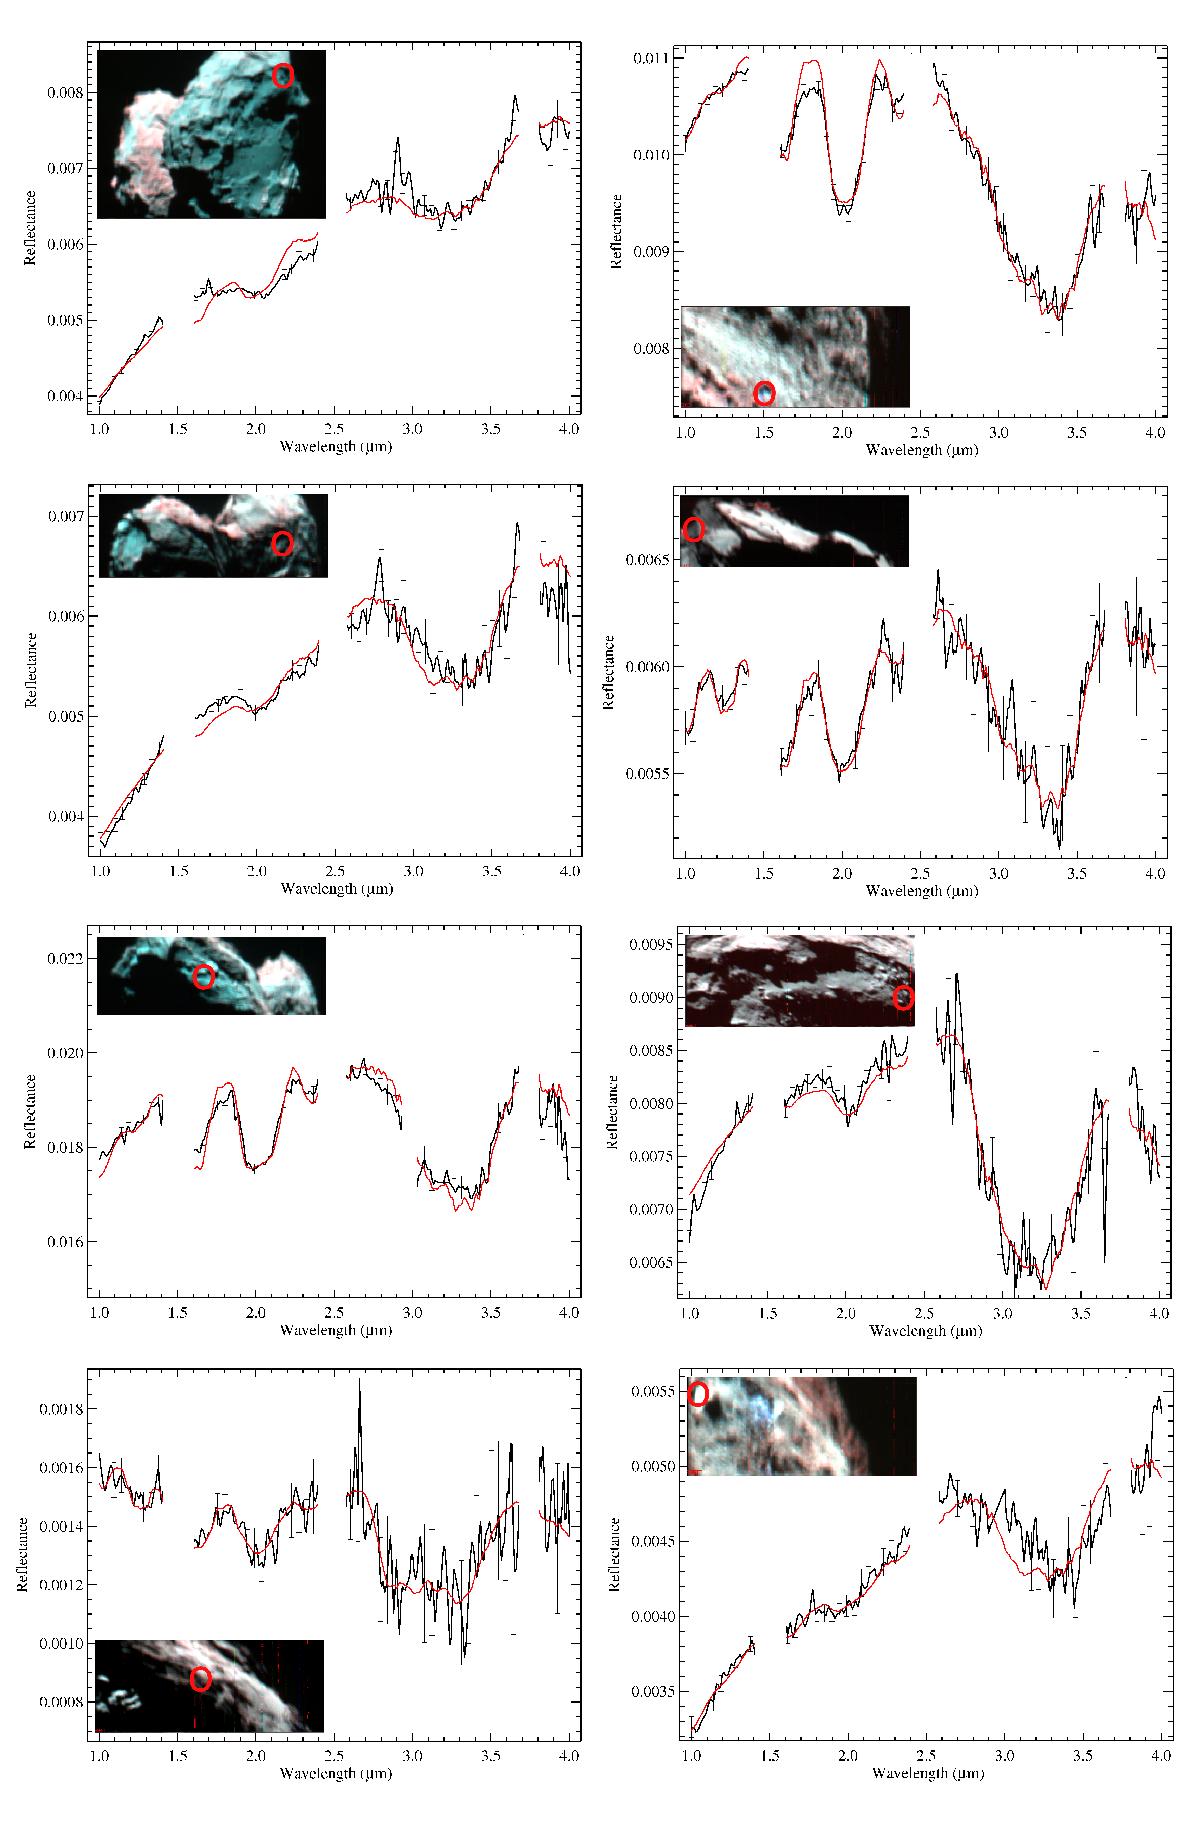
VIRTIS-M infrared data of the eight spots. Spots 1–4 are shown in the left column from top to bottom. Spots 5–8 in the right column from top to bottom. Infrared images in the insert of the plot are built from a combination of spectral bands taken at 1.32 μm (B channel), 2.0 μm (G), 4.0 μm (R). For each spot, we report the VIRTIS-M observed reflectance (black curve), not corrected for phase angle, and best fit (red curve) as derived from the pixels reported in Table 3 and indicated by red circles on the images. The gaps in the spectral ranges correspond to order-sorting filter-junction wavelengths that can produce unreliable features and, for this reason, are not taken into account in the analysis.
Current usage metrics show cumulative count of Article Views (full-text article views including HTML views, PDF and ePub downloads, according to the available data) and Abstracts Views on Vision4Press platform.
Data correspond to usage on the plateform after 2015. The current usage metrics is available 48-96 hours after online publication and is updated daily on week days.
Initial download of the metrics may take a while.