Fig. 2
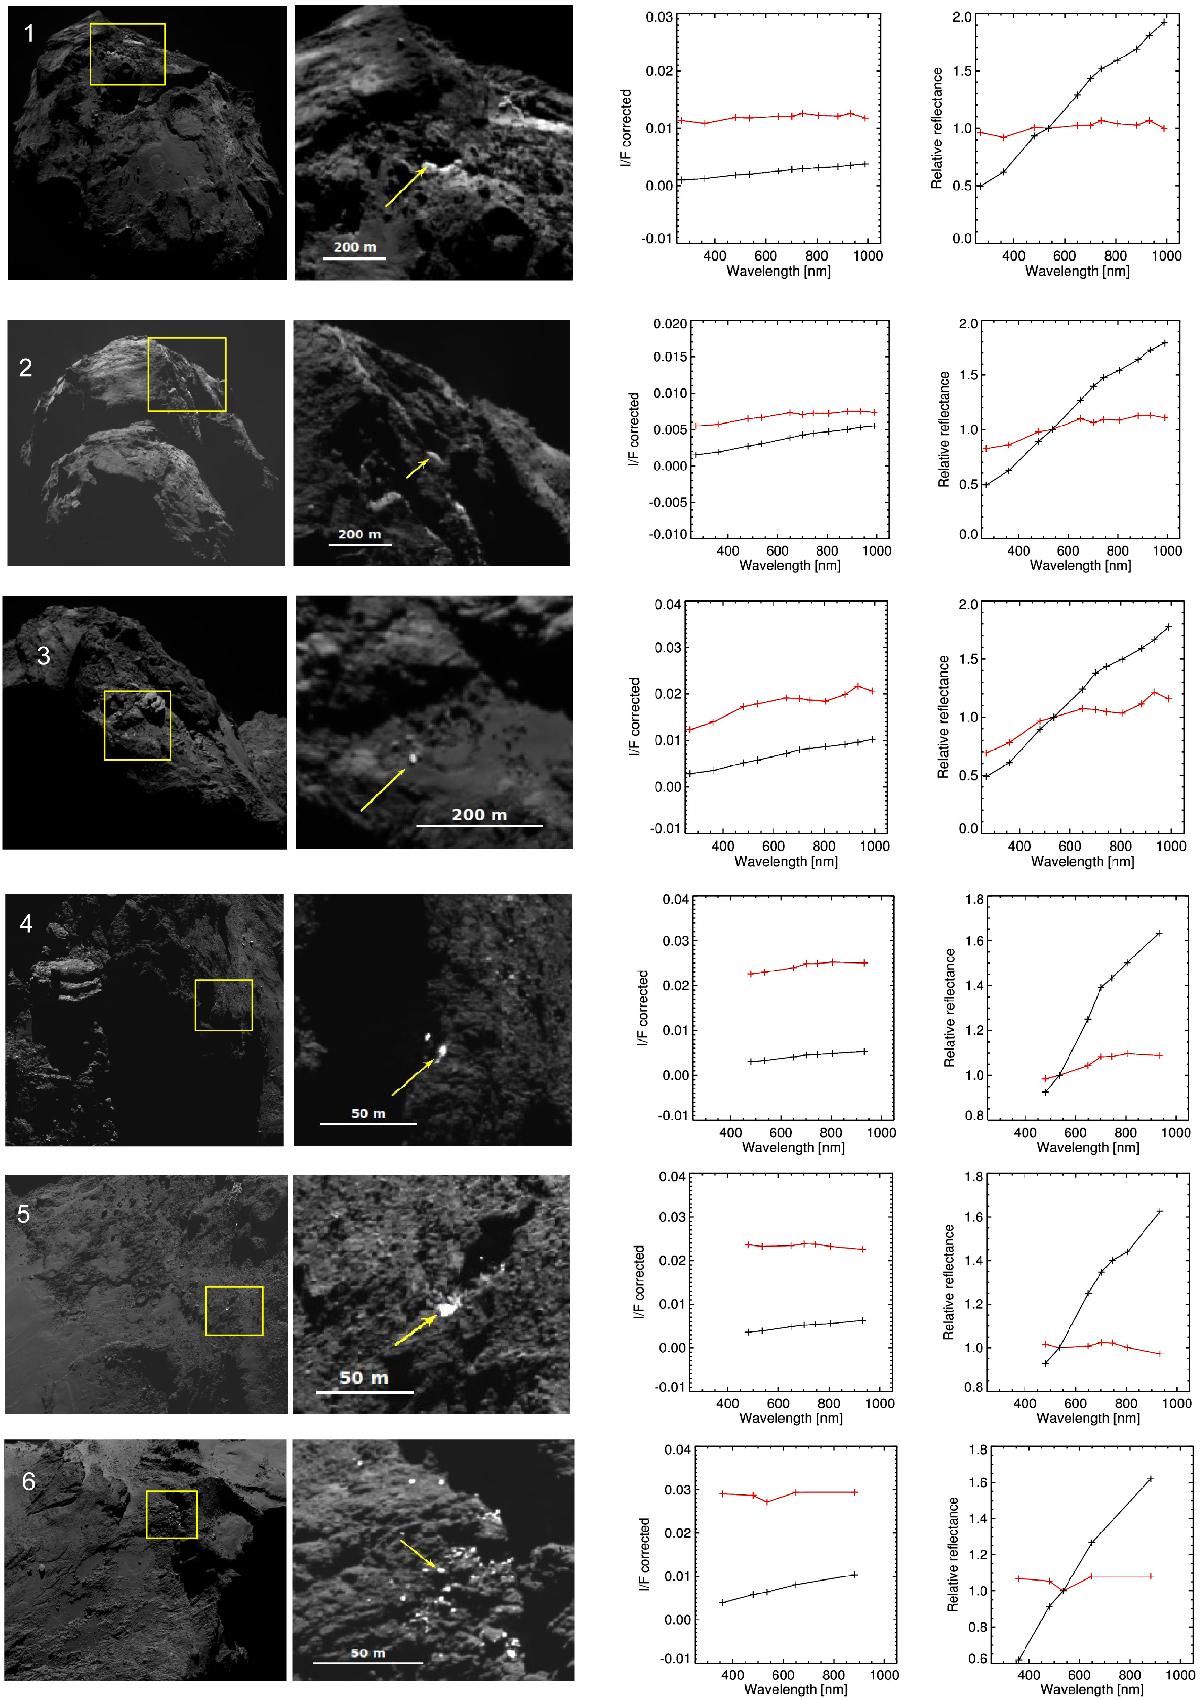
NAC OSIRIS images (first column) for the eight spots reported in Table 1 with a zoom on the spot (second column). The images have been taken with F22 filter (at 649.2 nm). The arrows indicate the spots that have been analysed using boxes of 3 × 3 pixels. The measured I/F(α) of the bright spots are reported in red, while the surrounding area is reported in black (third column). The relative reflectance (normalized to F23 at 535 nm) of the indicated bright spot in red and the surrounding area in black are represented in the fourth column.
Current usage metrics show cumulative count of Article Views (full-text article views including HTML views, PDF and ePub downloads, according to the available data) and Abstracts Views on Vision4Press platform.
Data correspond to usage on the plateform after 2015. The current usage metrics is available 48-96 hours after online publication and is updated daily on week days.
Initial download of the metrics may take a while.