Fig. 1
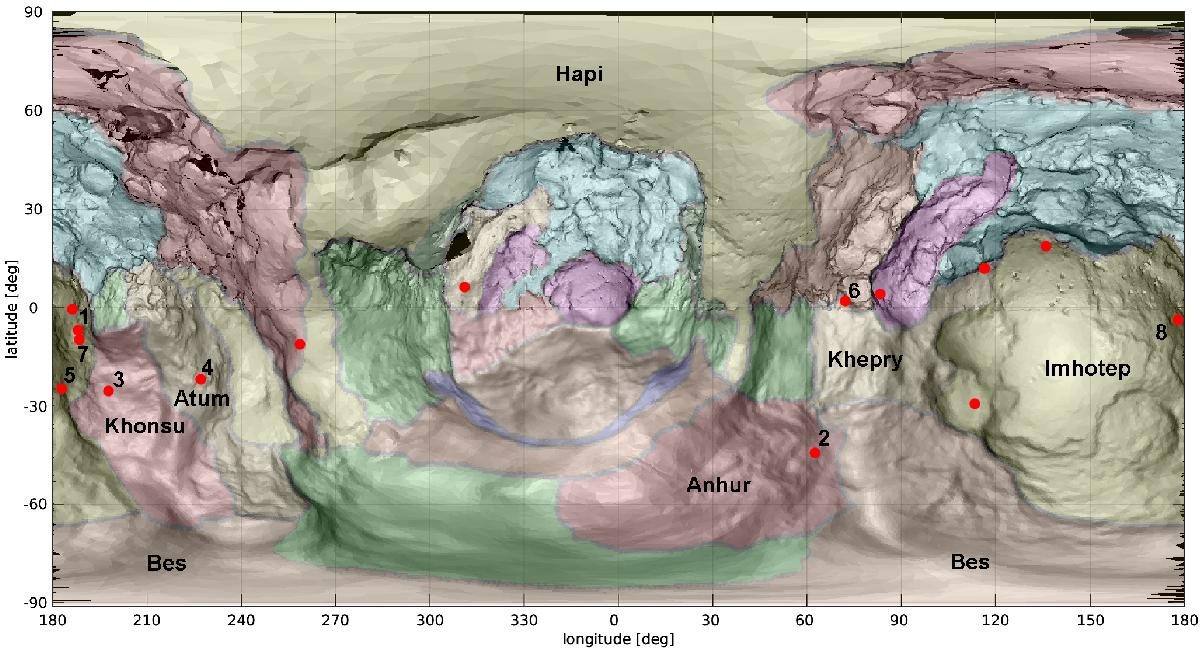
Map of comet 67P/Churyumov-Gerasimenko, resulting from merging a more detailed shape model SHAP4S (Preusker et al. 2015) for the northern hemisphere and shape model SHAP5 (Jorda et al. 2016) for the southern hemisphere. In red the selected bright spots are reported, based on OSIRIS images and a spectro-photometric analysis, considered as good targets to be investigated by an analysis of VIRTIS data, plus the two bright spots analysed by Filacchione et al. (2016a). The numbers (1–8) represent the spots with positive detection of H2O ice by VIRTIS analysis discussed in this paper.
Current usage metrics show cumulative count of Article Views (full-text article views including HTML views, PDF and ePub downloads, according to the available data) and Abstracts Views on Vision4Press platform.
Data correspond to usage on the plateform after 2015. The current usage metrics is available 48-96 hours after online publication and is updated daily on week days.
Initial download of the metrics may take a while.